Fundamentals were a mixed bag for the Washington, D.C., office market in the first four months of the new year, except for investment activity, which grew significantly since last year, according to the latest CommercialEdge data.
Nationwide, the upcoming maturities for office debt are a major concern for players in the sector, a recent Commercial Property Executive special report shows. Over the next five years, roughly $615 billion in office loans are expected to mature, leading to owners and investors scrambling to reduce their exposure.
This could explain why D.C. office sales started to increase at a significant pace since last year, with companies looking for opportunities to convert, redevelop or reposition these assets. Over the first four months of the year, the metro recorded $937 million in sales, up 66.0 percent year-over-year and clocking in the number one spot among all major metros tracked by CommercialEdge.
Construction slows to a crawl
In April, metro Washington, D.C., had 3.3 million square feet of rentable office space under construction, across 19 properties. This accounted for 0.9 percent of existing stock, 60 basis points below the national figure.
Construction activity in the capital remained sluggish and well below most other gateway markets—except Chicago (0.3 percent of stock) and Manhattan (0.6 percent). Development was strongest in Boston (5.6 percent) and San Francisco (3.2 percent).
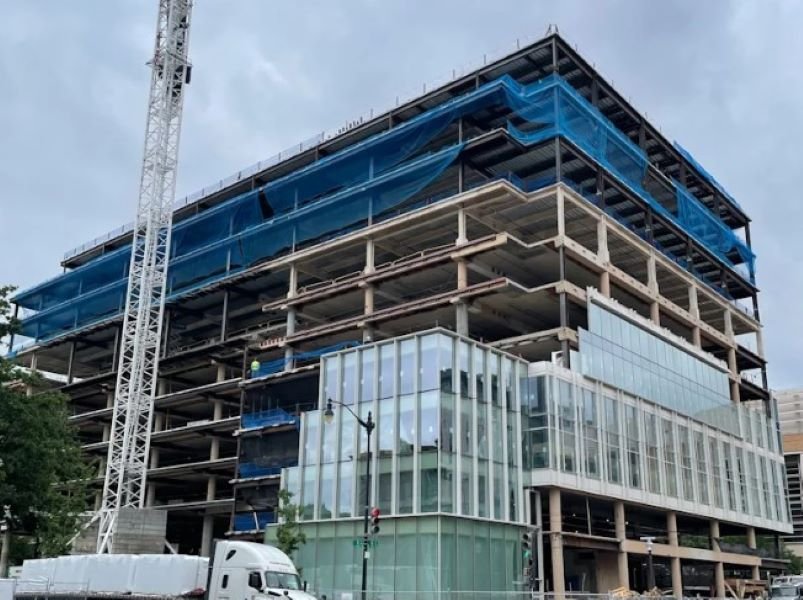
The largest office asset underway in Washington, D.C., was the nearly 400,000-square-foot 600 Fifth St., which topped out last month. Developers Rockefeller Group and Stonebridge expect the $375 million project to be complete by 2026. Year-to-date through April, three properties—encompassing 435,428 rentable square feet—came online in Washinton, D.C. This was a decrease to less than half of the amount recorded in the same period last year. Meanwhile, nationwide completions were down by only 1.5 percent.
A few gateway markets stood out with significant office space coming online in this period, including Boston (1.4 million square feet), San Francisco (1.4 million square feet) and Chicago (875,000 square feet). Meanwhile, Washington outperformed Manhattan (57,000 square feet), Los Angeles (303,175 square feet) and Miami (10,860 square feet).
The largest office asset that came online in Washington, D.C., year-to-date through April was the 237,000-square-foot Building 4 of Reunion Square in the Northeast D.C. submarket. Four Points LLC and Curtis Development are continuing work at the master-planned Reunion Square project, which is slated to total 1.5 million square feet, 950,000 square feet of which will be office space, alongside a 130,000-square-foot retail component and 480 multifamily units.
Developers broke ground on a single, 210,622-square-foot property in the first four months of the year in the metro, on par with the same low activity recorded last year.
D.C. office investment volume outpaced all other major metros
Washington, D.C., office investment led activity nationwide, with $937 million in sales volume recorded through April, up 66.0 percent year-over-year. A total of 21 properties changed hands, 14 of which were conventional sales, encompassing more than 4 million square feet of space. This was a sharp increase from the 2.2 million square feet that traded in the same period last year.
These assets traded at roughly $345 per square foot on average, which was more than double the nation’s $157 figure. These were some of the priciest investments in the nation, as only a handful of other markets recorded a higher average price per square foot—Manhattan ($351), Los Angeles ($359) and San Francisco ($407).

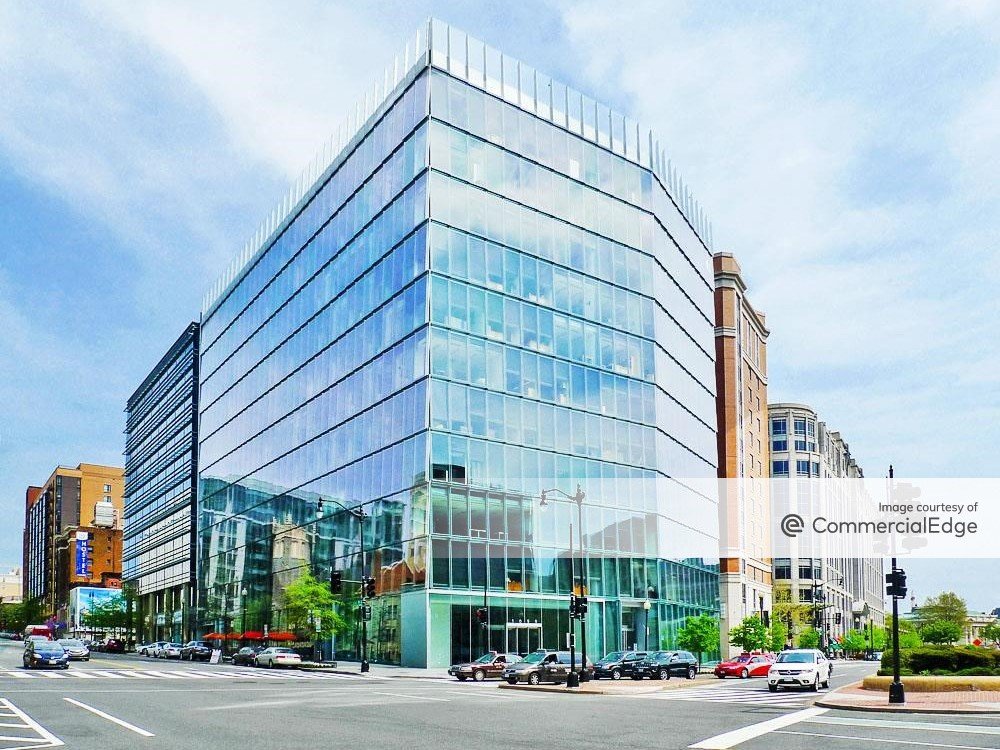
One significant deal was Quadrangle Development Corp.’s $95 million acquisition of 1099 New York Ave. NW. Credit Suisse sold the downtown asset two months ago for approximately $536 per square foot—among the highest rates recorded in these first four months.
The incoming wave of office debt maturity looms over Washington, D.C., as well—it measured nearly $52 billion in October last year. Owners and investors are looking to refinance and reposition assets, with new deals emerging. One recent example was Monday Properties’ $205.5 million refinancing of two office properties. Citi Real Estate provided the two, 5-year CMBS loans, of $173 and $32.5 million.
A few significant leases help buoy the market
The Washington, D.C. office market’s vacancy rate was at 16.8 percent as of April, 200 basis points lower than the national figure. The capital also continued to outperform most other gateway markets, including Manhattan (17.6 percent), Chicago (19.1 percent) and Seattle (23.0 percent).

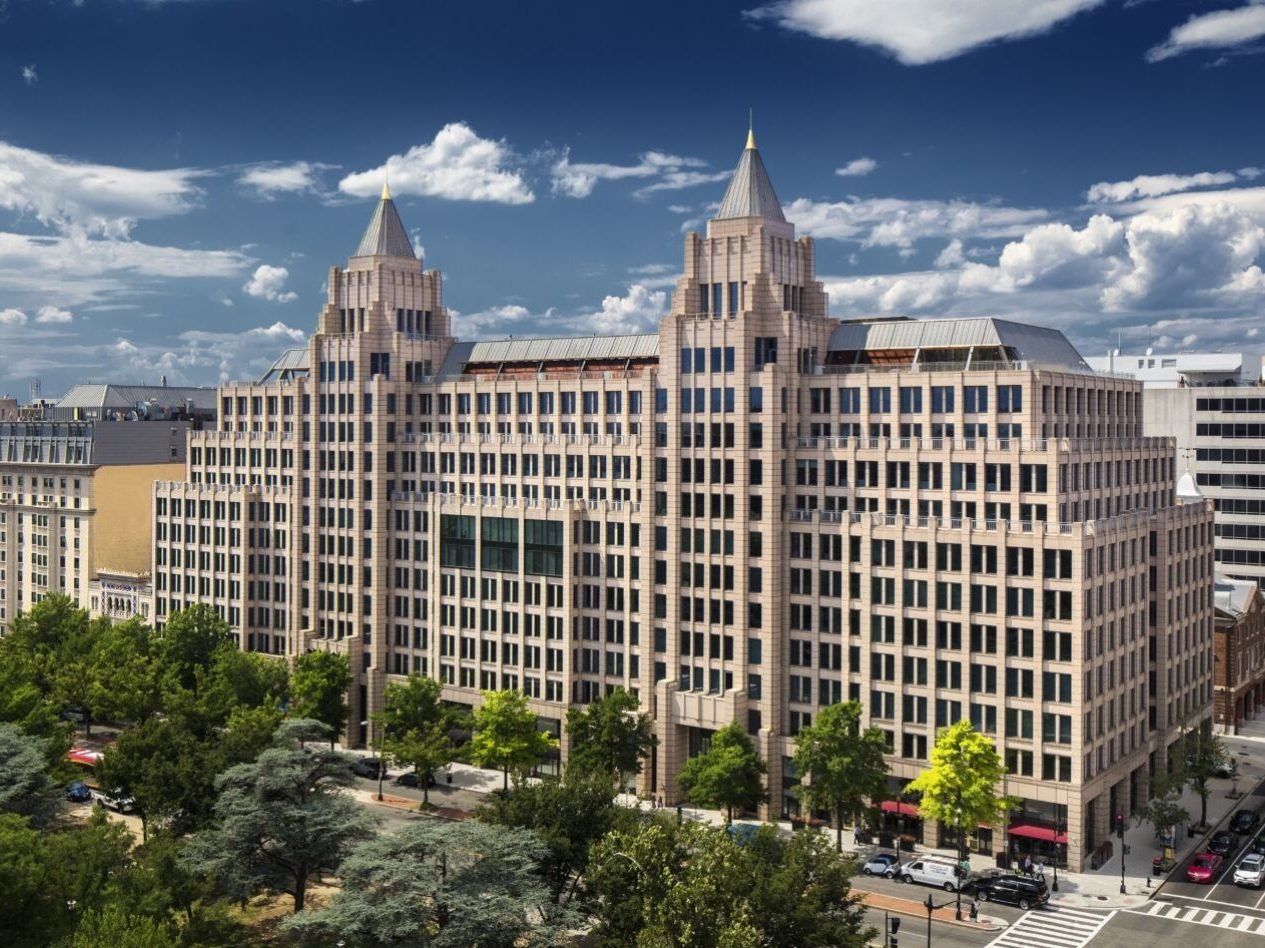
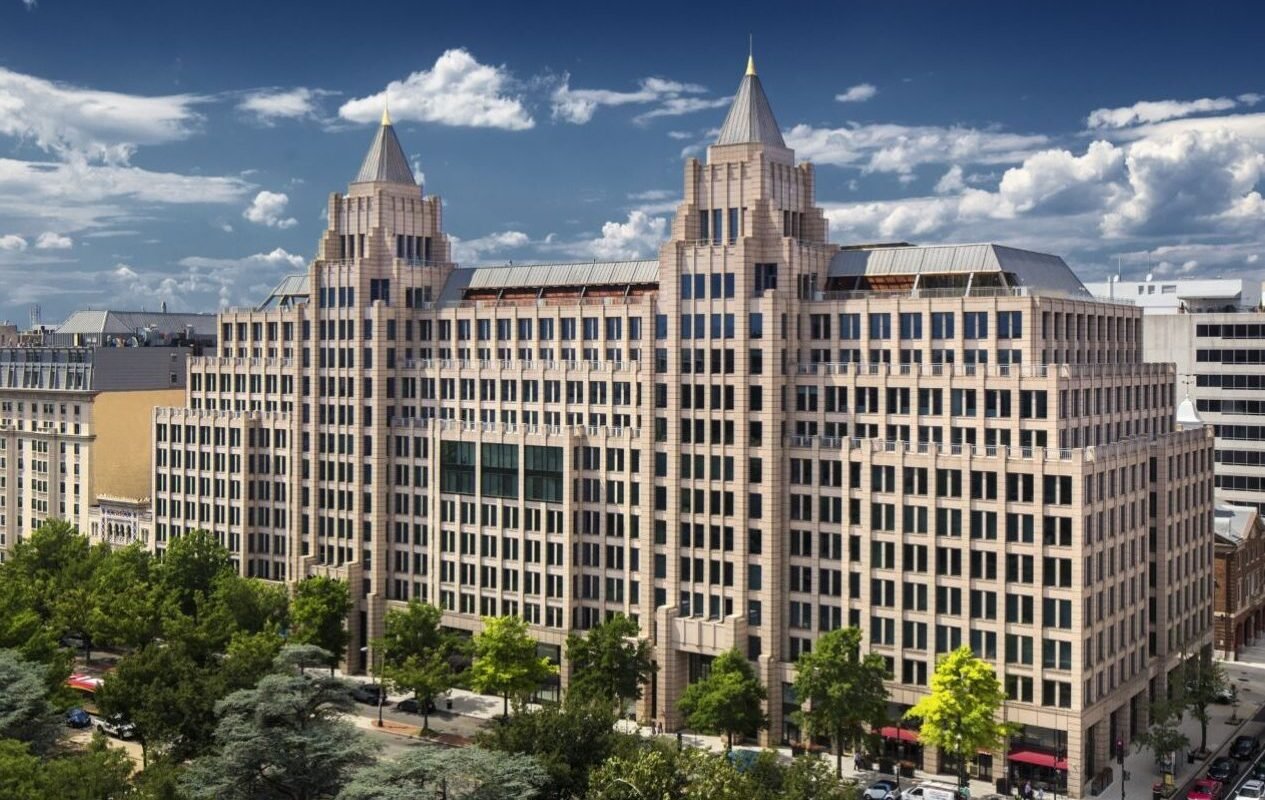
The most significant lease deal year-to-date through April was an extension. Washington Post renewed its 300,000-square-foot agreement with Hines, at One Franklin Square. The media publisher and paper of record has been a tenant there since 2016.
When it comes to new deals, these were a bit scarcer and smaller. For example, Monday Properties signed a new tenant at its 1812 N. Moore St. property in April. Graham Holdings Co. will occupy the entire 21st floor, a total of 24,023 square feet. JLL negotiated the 15-year agreement.
Coworking stays in shape
D.C.’s office market retained a significant portion of shared space inventory—some 3.3 million square feet in April, which accounted for 1.6 percent of the total office stock. This share was on par with the 1.8 percent national figure, as well as Boston’s 1.8 percent and just below Chicago’s 1.9 percent. Other gateway markets with more significant coworking segments included San Francisco and Seattle (2.0 percent), Los Angeles (2.2 percent), Manhattan (2.5 percent) and Miami (3.7 percent).
WeWork continued to have the largest share of the coworking market, with nearly 800,000 square feet across 10 properties. Rounding out the list of top three players were Industrious (500,000 square feet) and Regus (480,000 square feet).


