


 Welcome to the 32nd UK Property Market Stats Show of 2025 – your go-to weekly TV Programme on the UK property market.
This week, I am joined by Toby Martin, as we unpack the key headlines for the week ending Sunday 17th August 2025.
✅ Listings (New to Market)
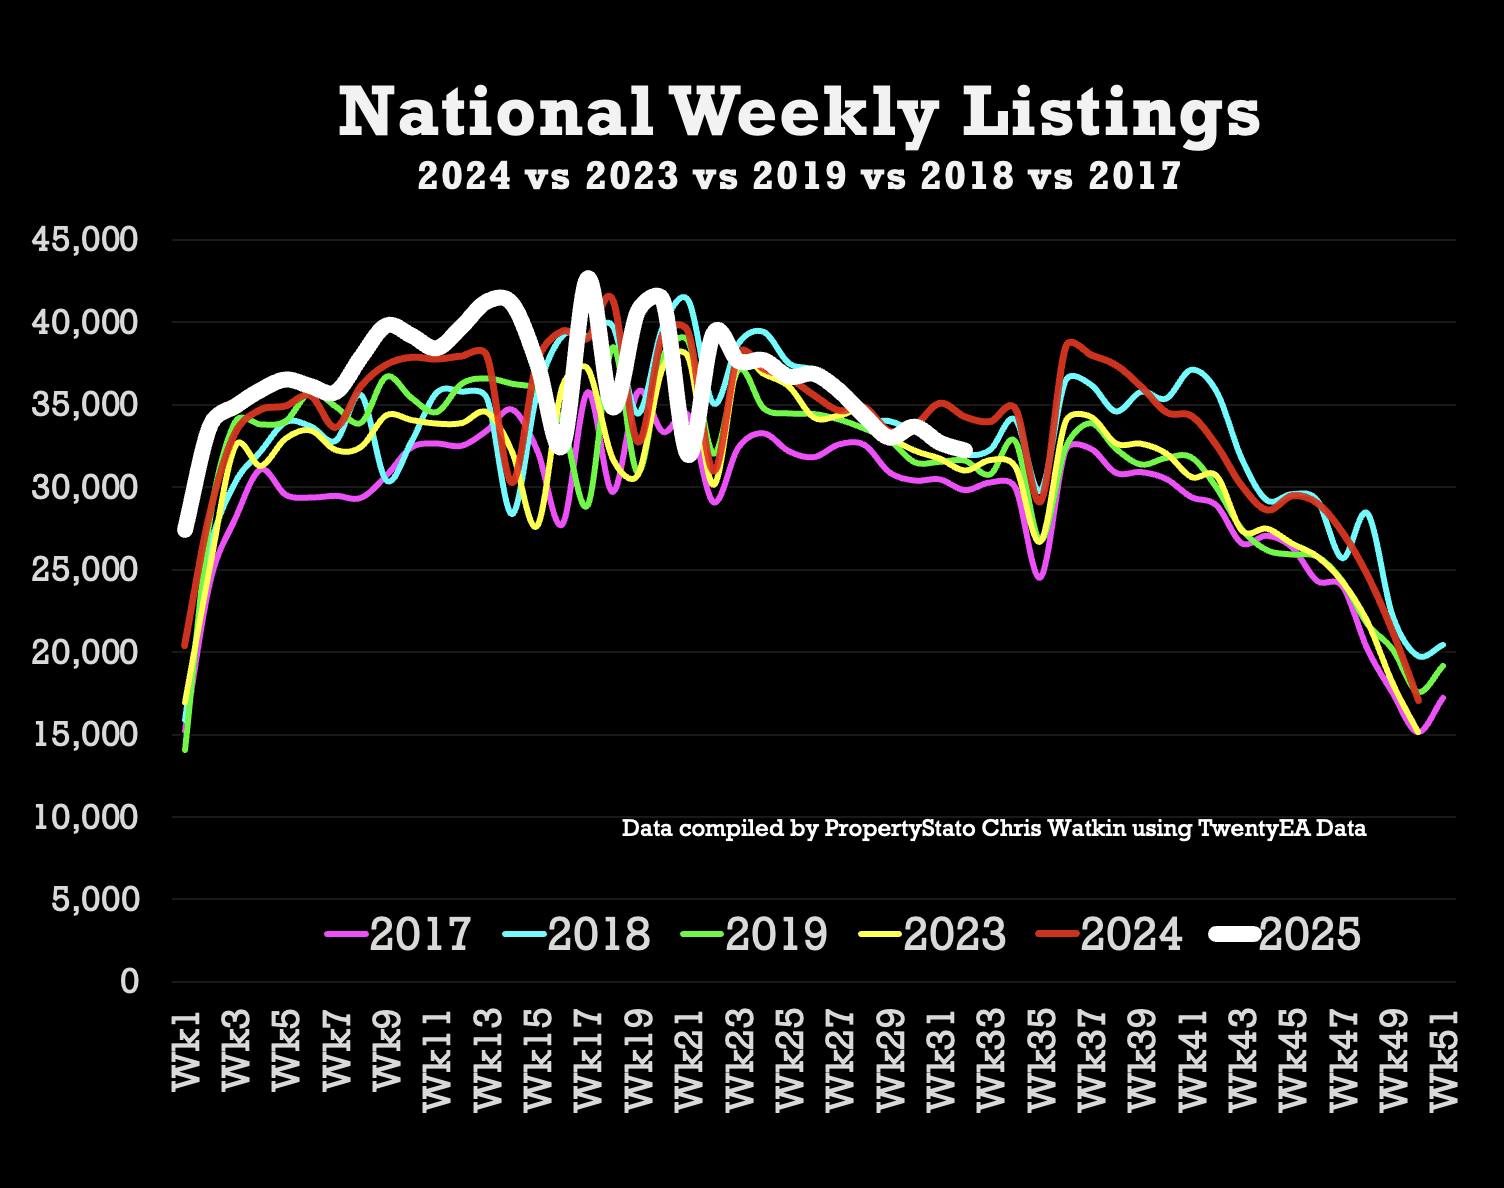
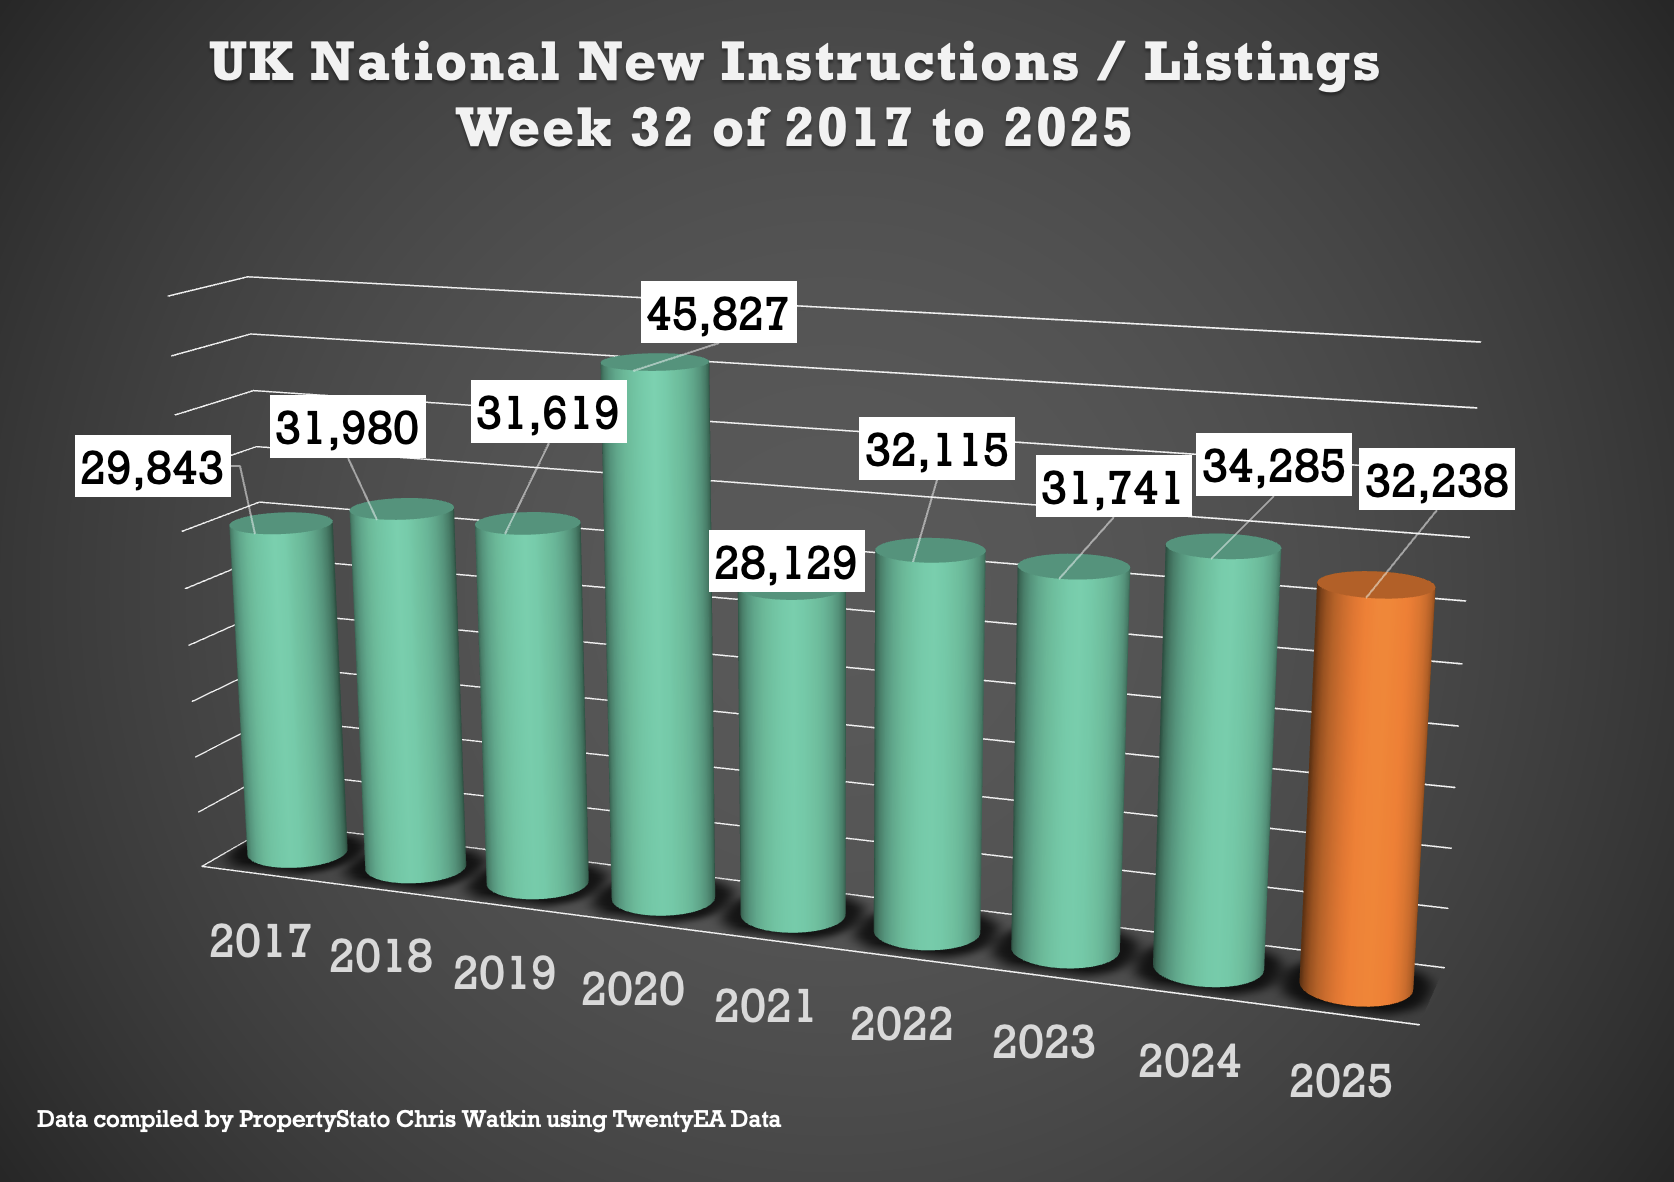
32.2k new listings this week (Down as expected from 32.7k last week).
2025 weekly average : 36.6k
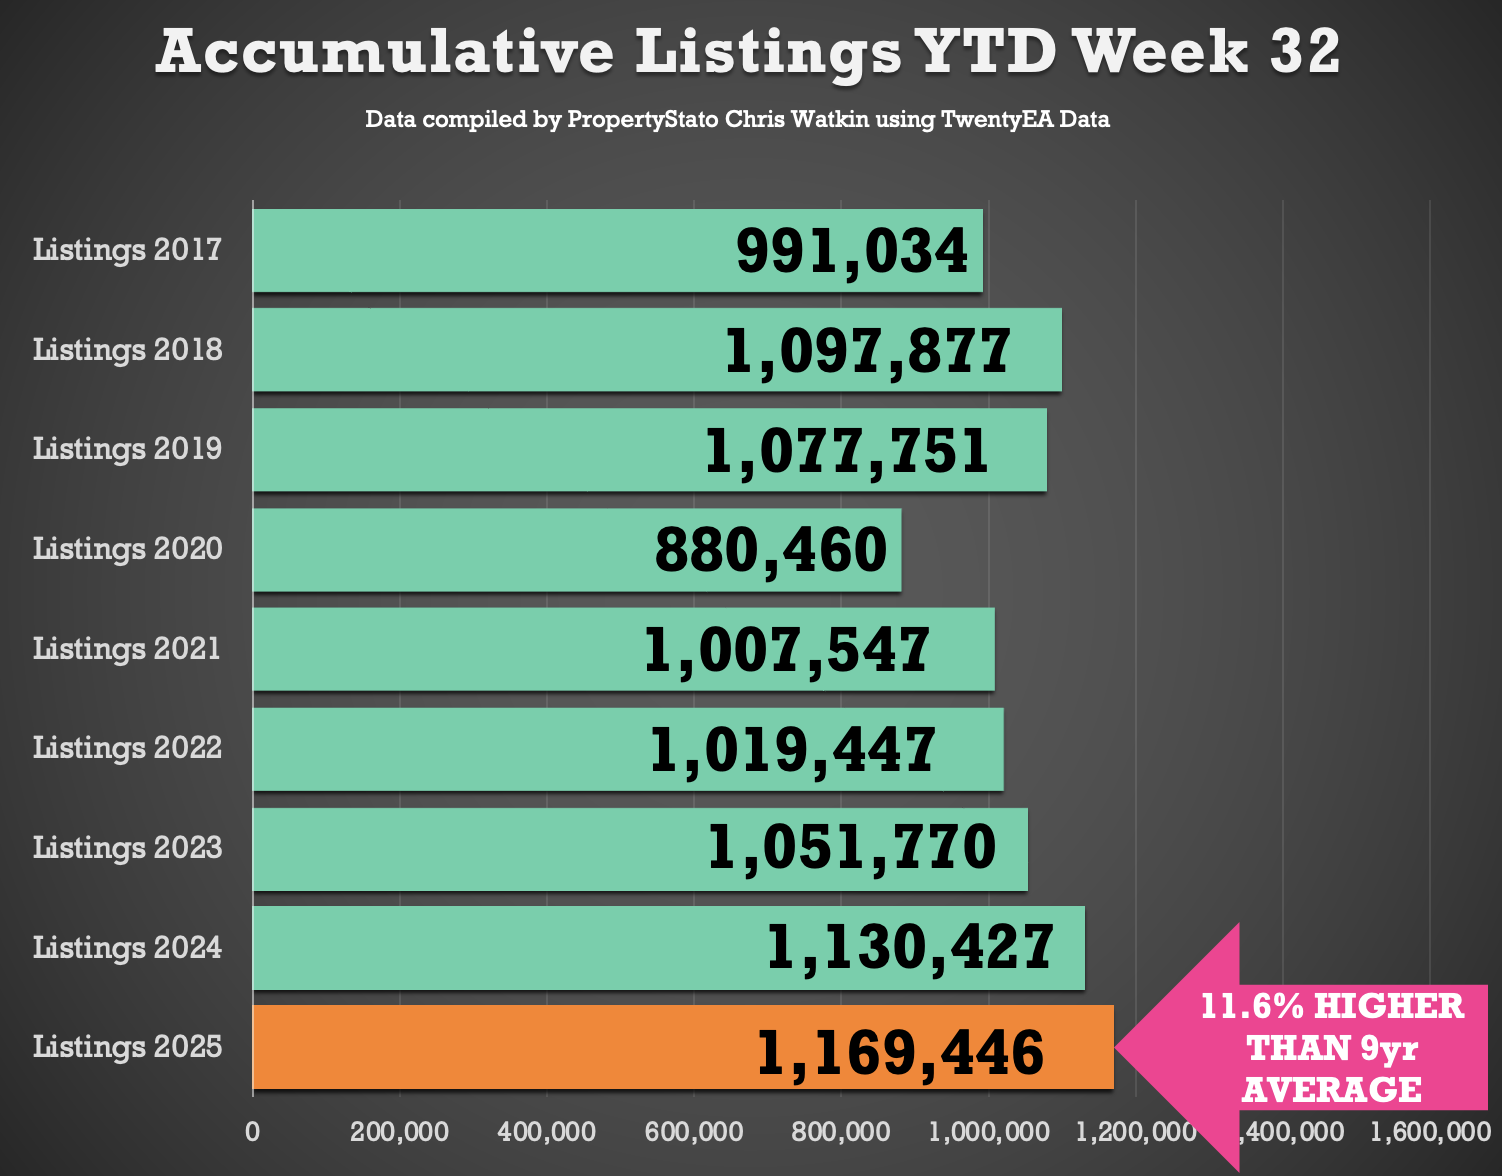
YTD listings are 3.5% higher than 2024 YTD and 7% above the 2017–19 YTD average (1.17m YTD vs 1.13m in 2024 YTD).
✅ Price Reductions
20.6k reductions this week (down from 21.8k last week – it is holiday season).
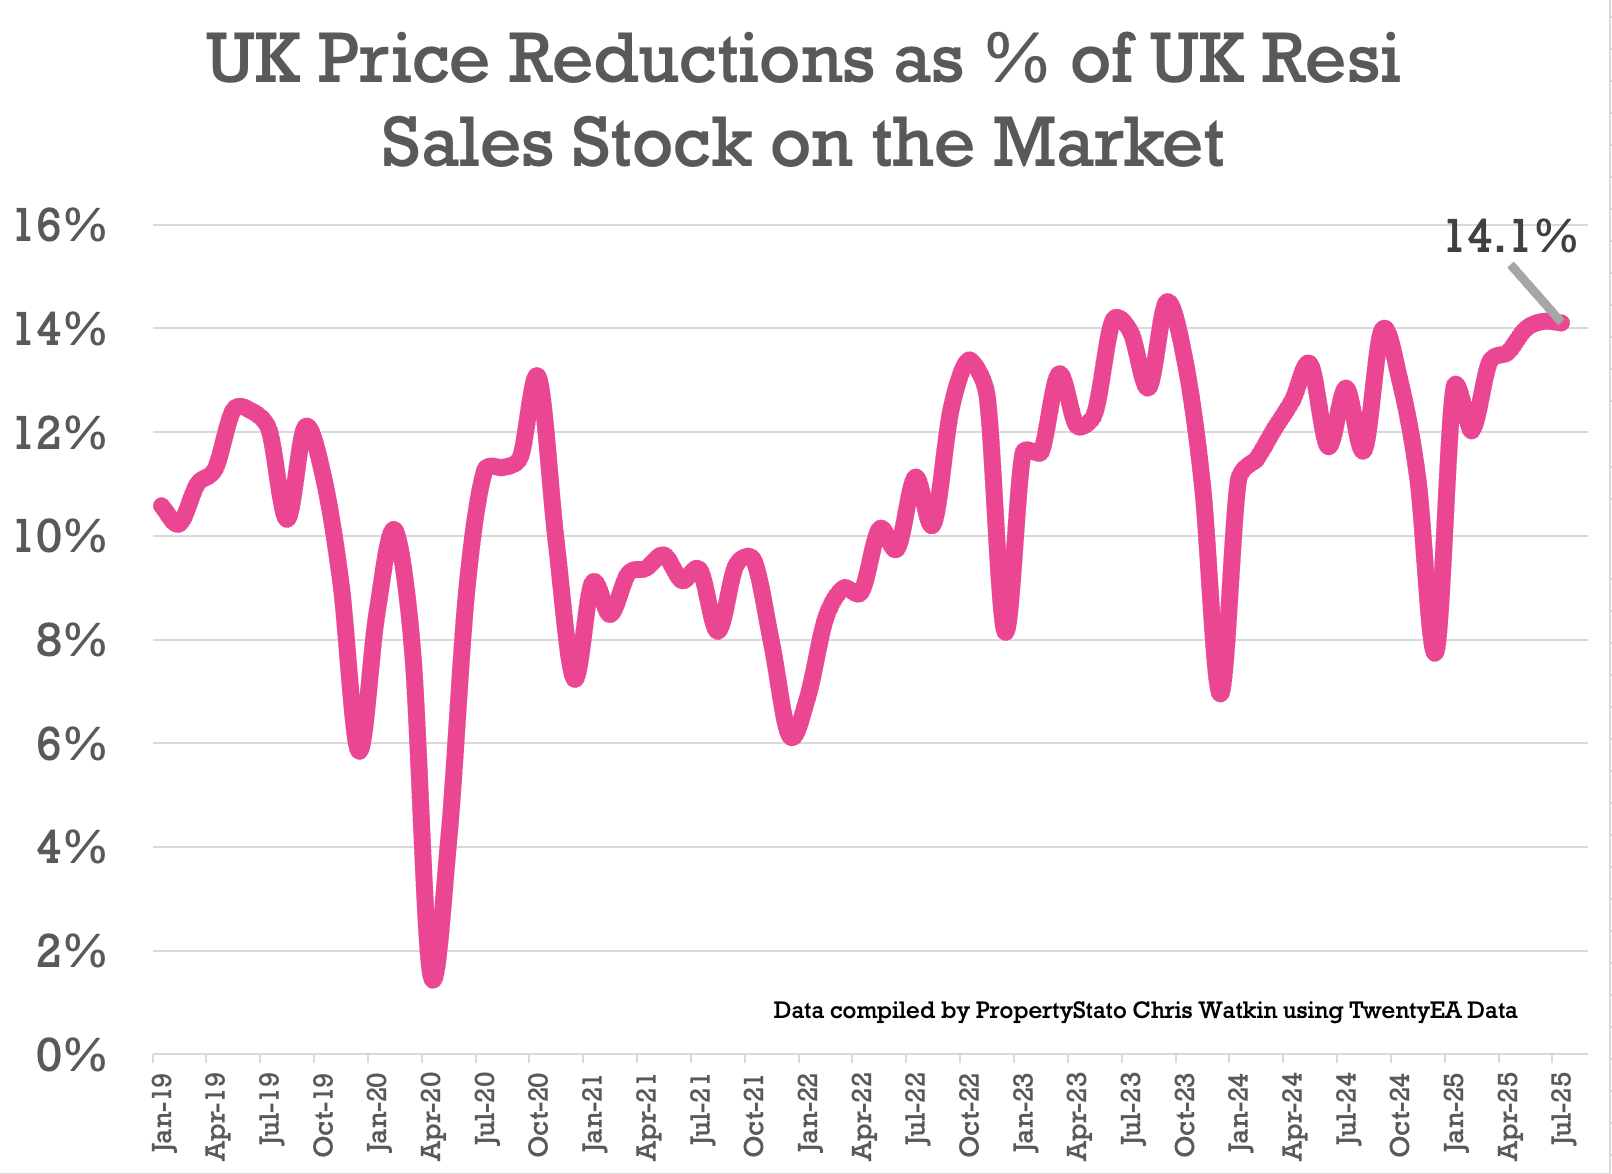
That’s still only 1 in 7.1 homes on the market being reduced monthly (14.1%)
For context:
• 14.1% in July, 14% in June & 13.4% in May
• 12.1% average in 2024
• Long-term 5-year average: 10.6%,
✅ Sales Agreed
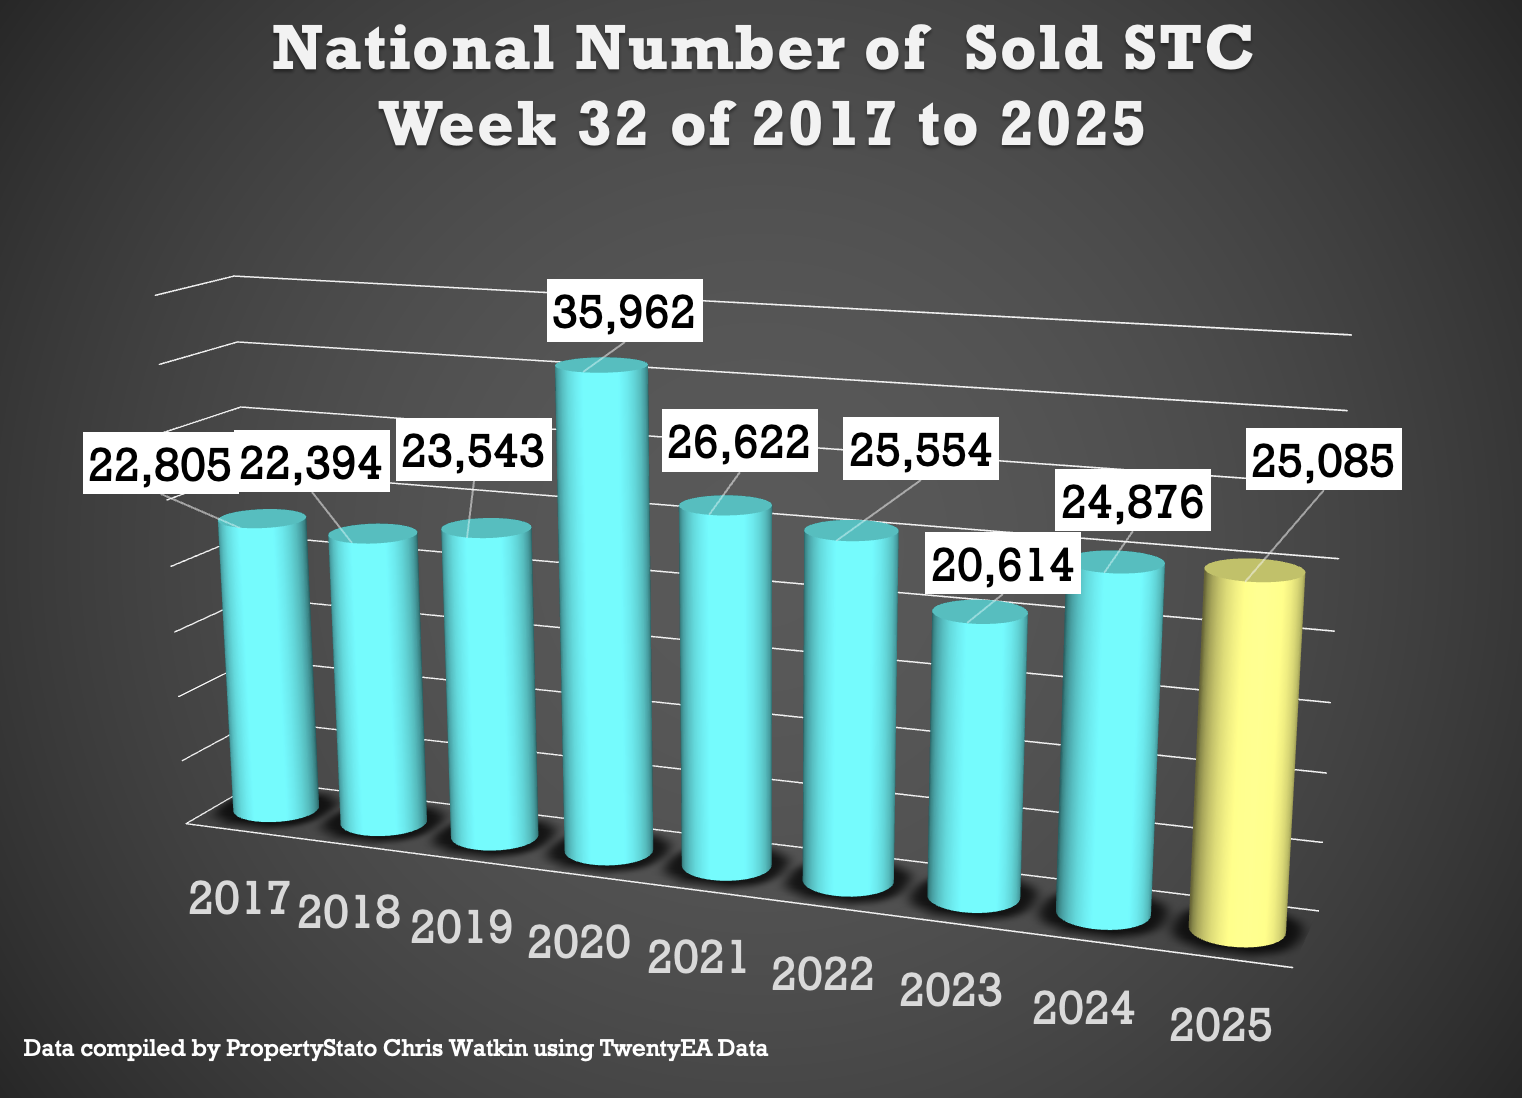
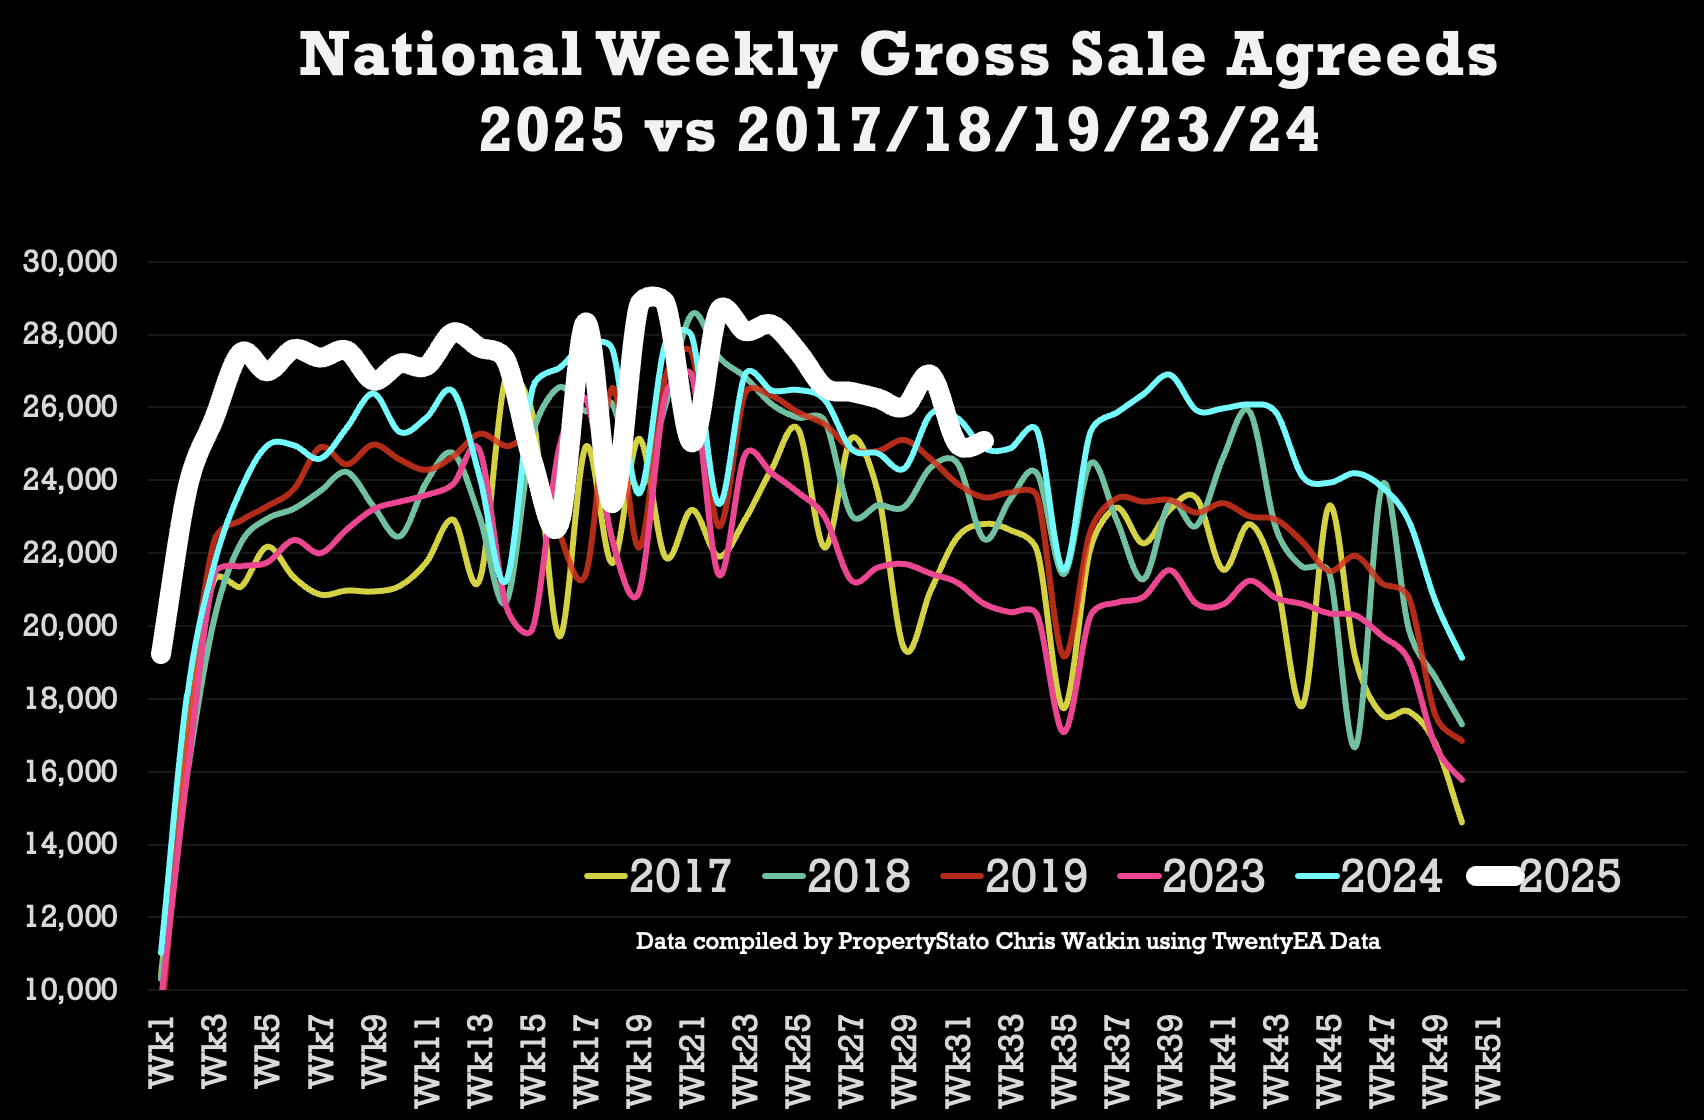
25k homes sold STC this week (the same as last week)
2025 weekly average : 26.5k
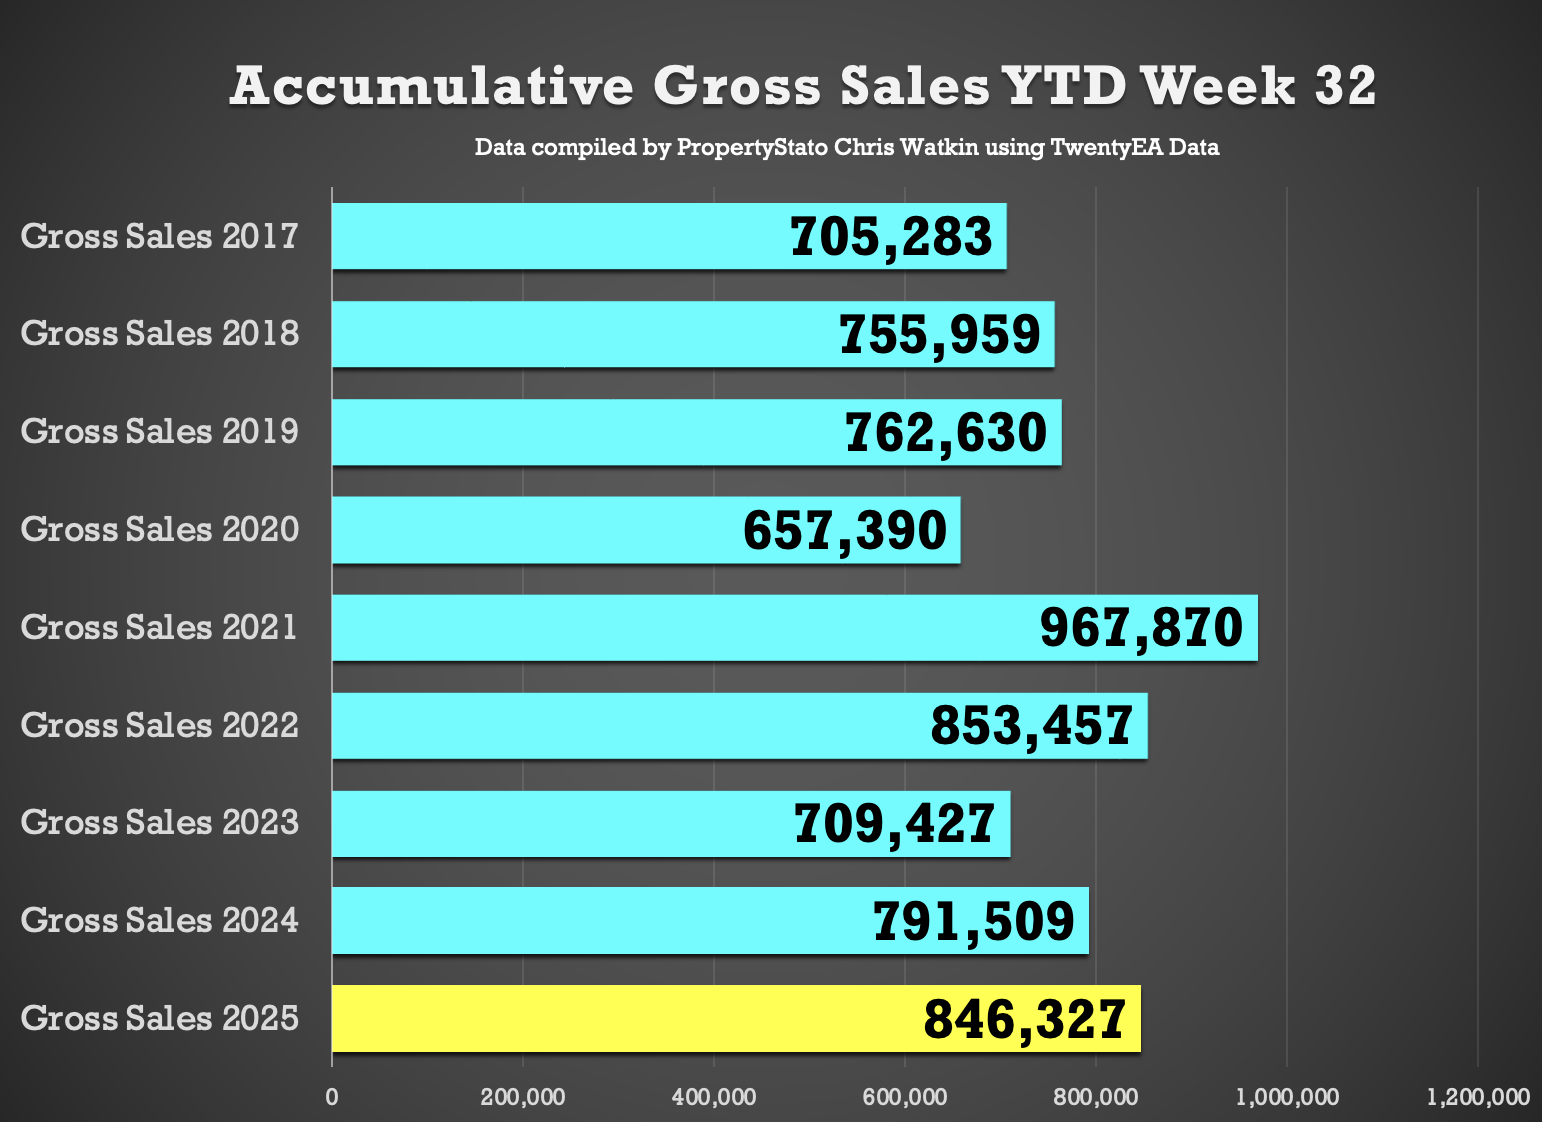
YTD agreed sales:
• 6.9% up on 2024 (846k vs 792k)
• 14.2% up on pre-Covid average of 741k (2017–19).
✅ Sell-Through Rate (July, in arrears)
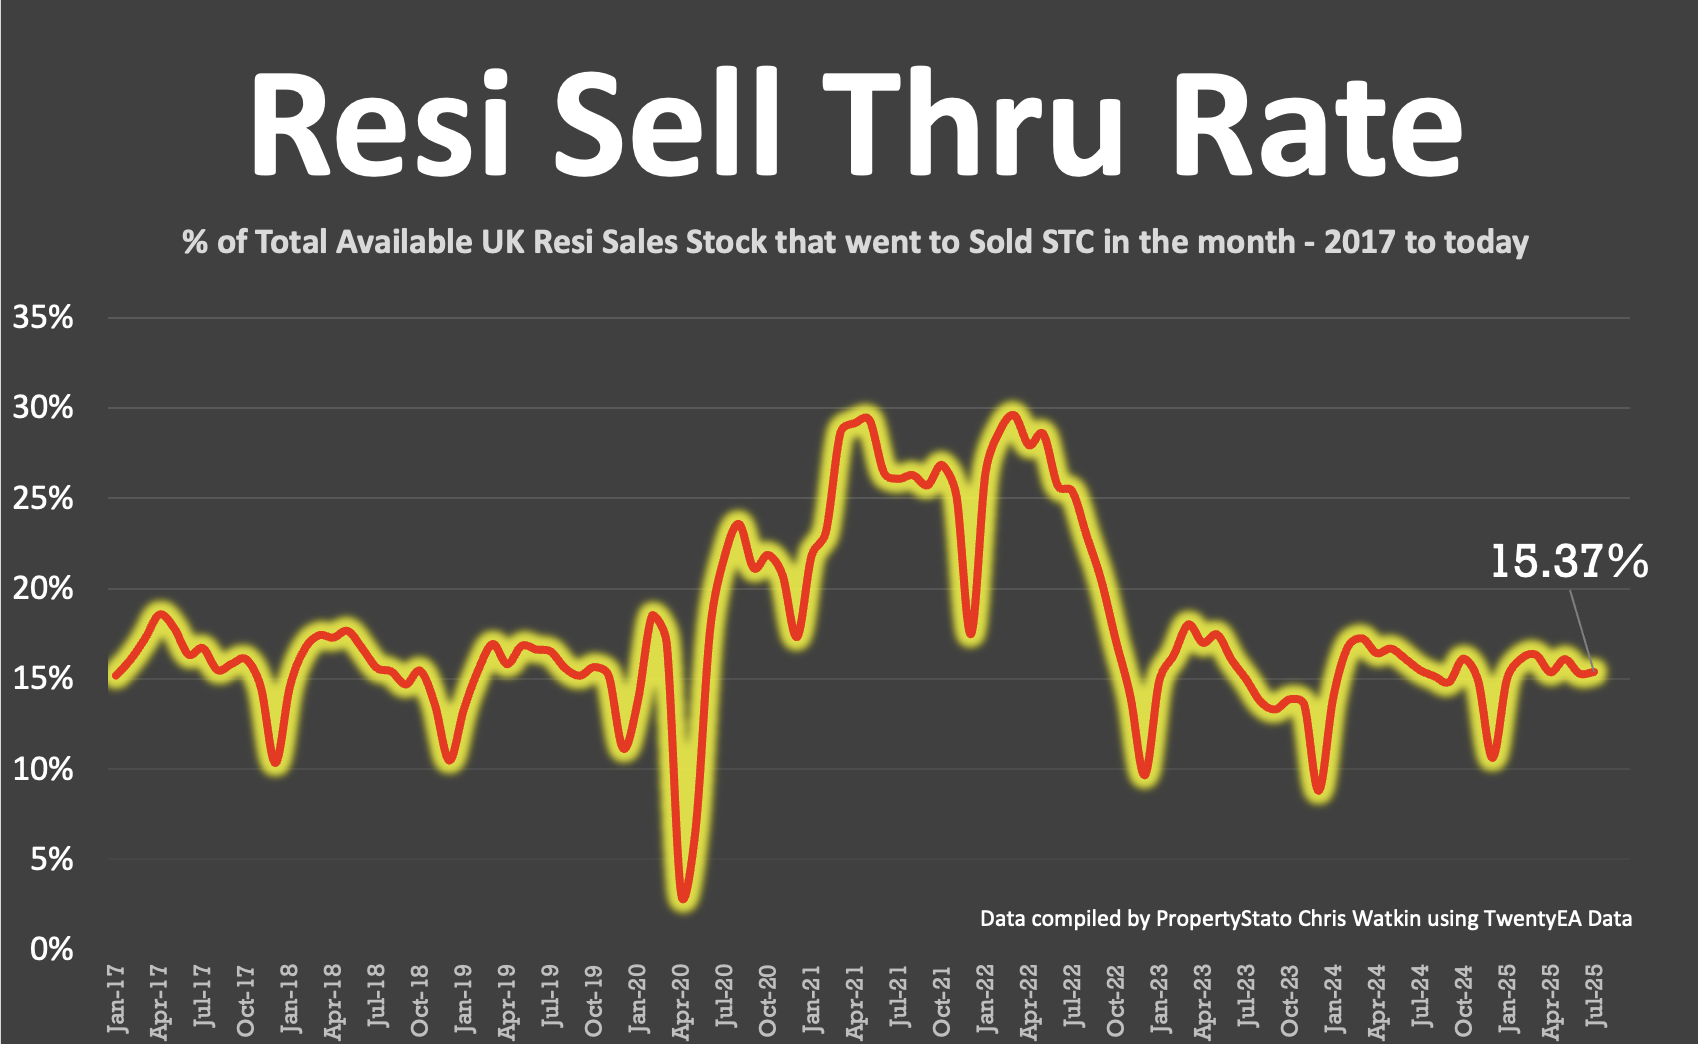
15.4% of properties on agent’s books went SSTC in July.
Up from 15.3% in June. 16.1% in May
2024 monthly average: 15.3%
8-year overall average: 17.9%.
✅ Sale Fall-Throughs
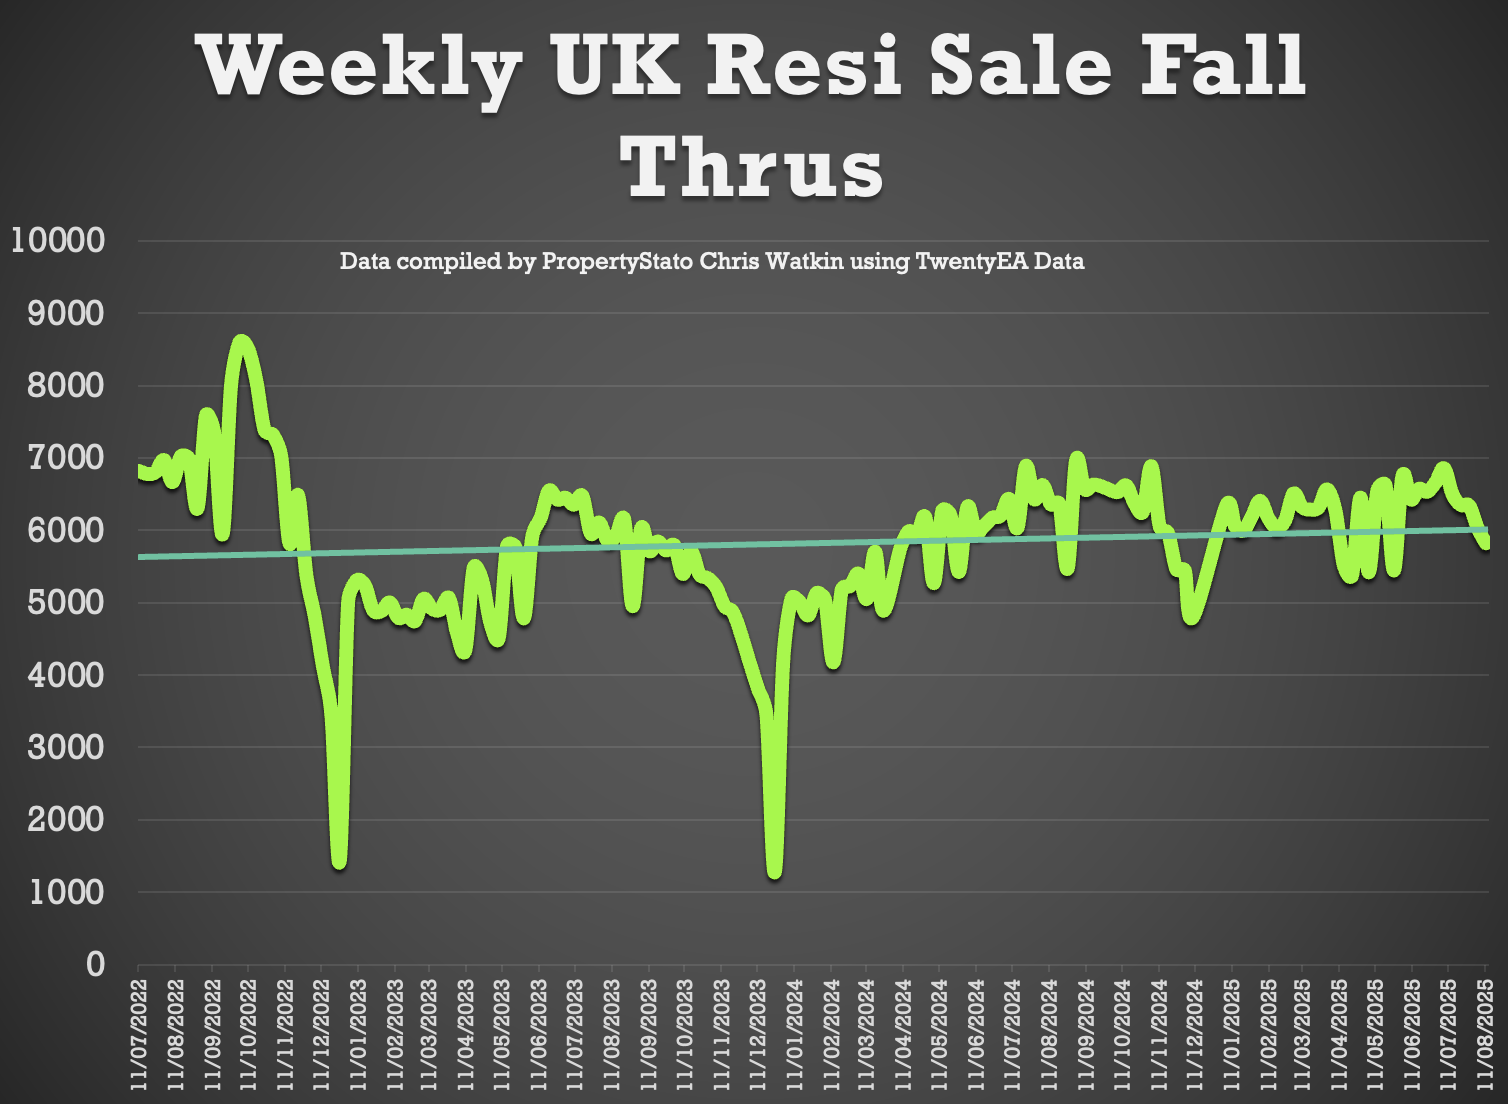
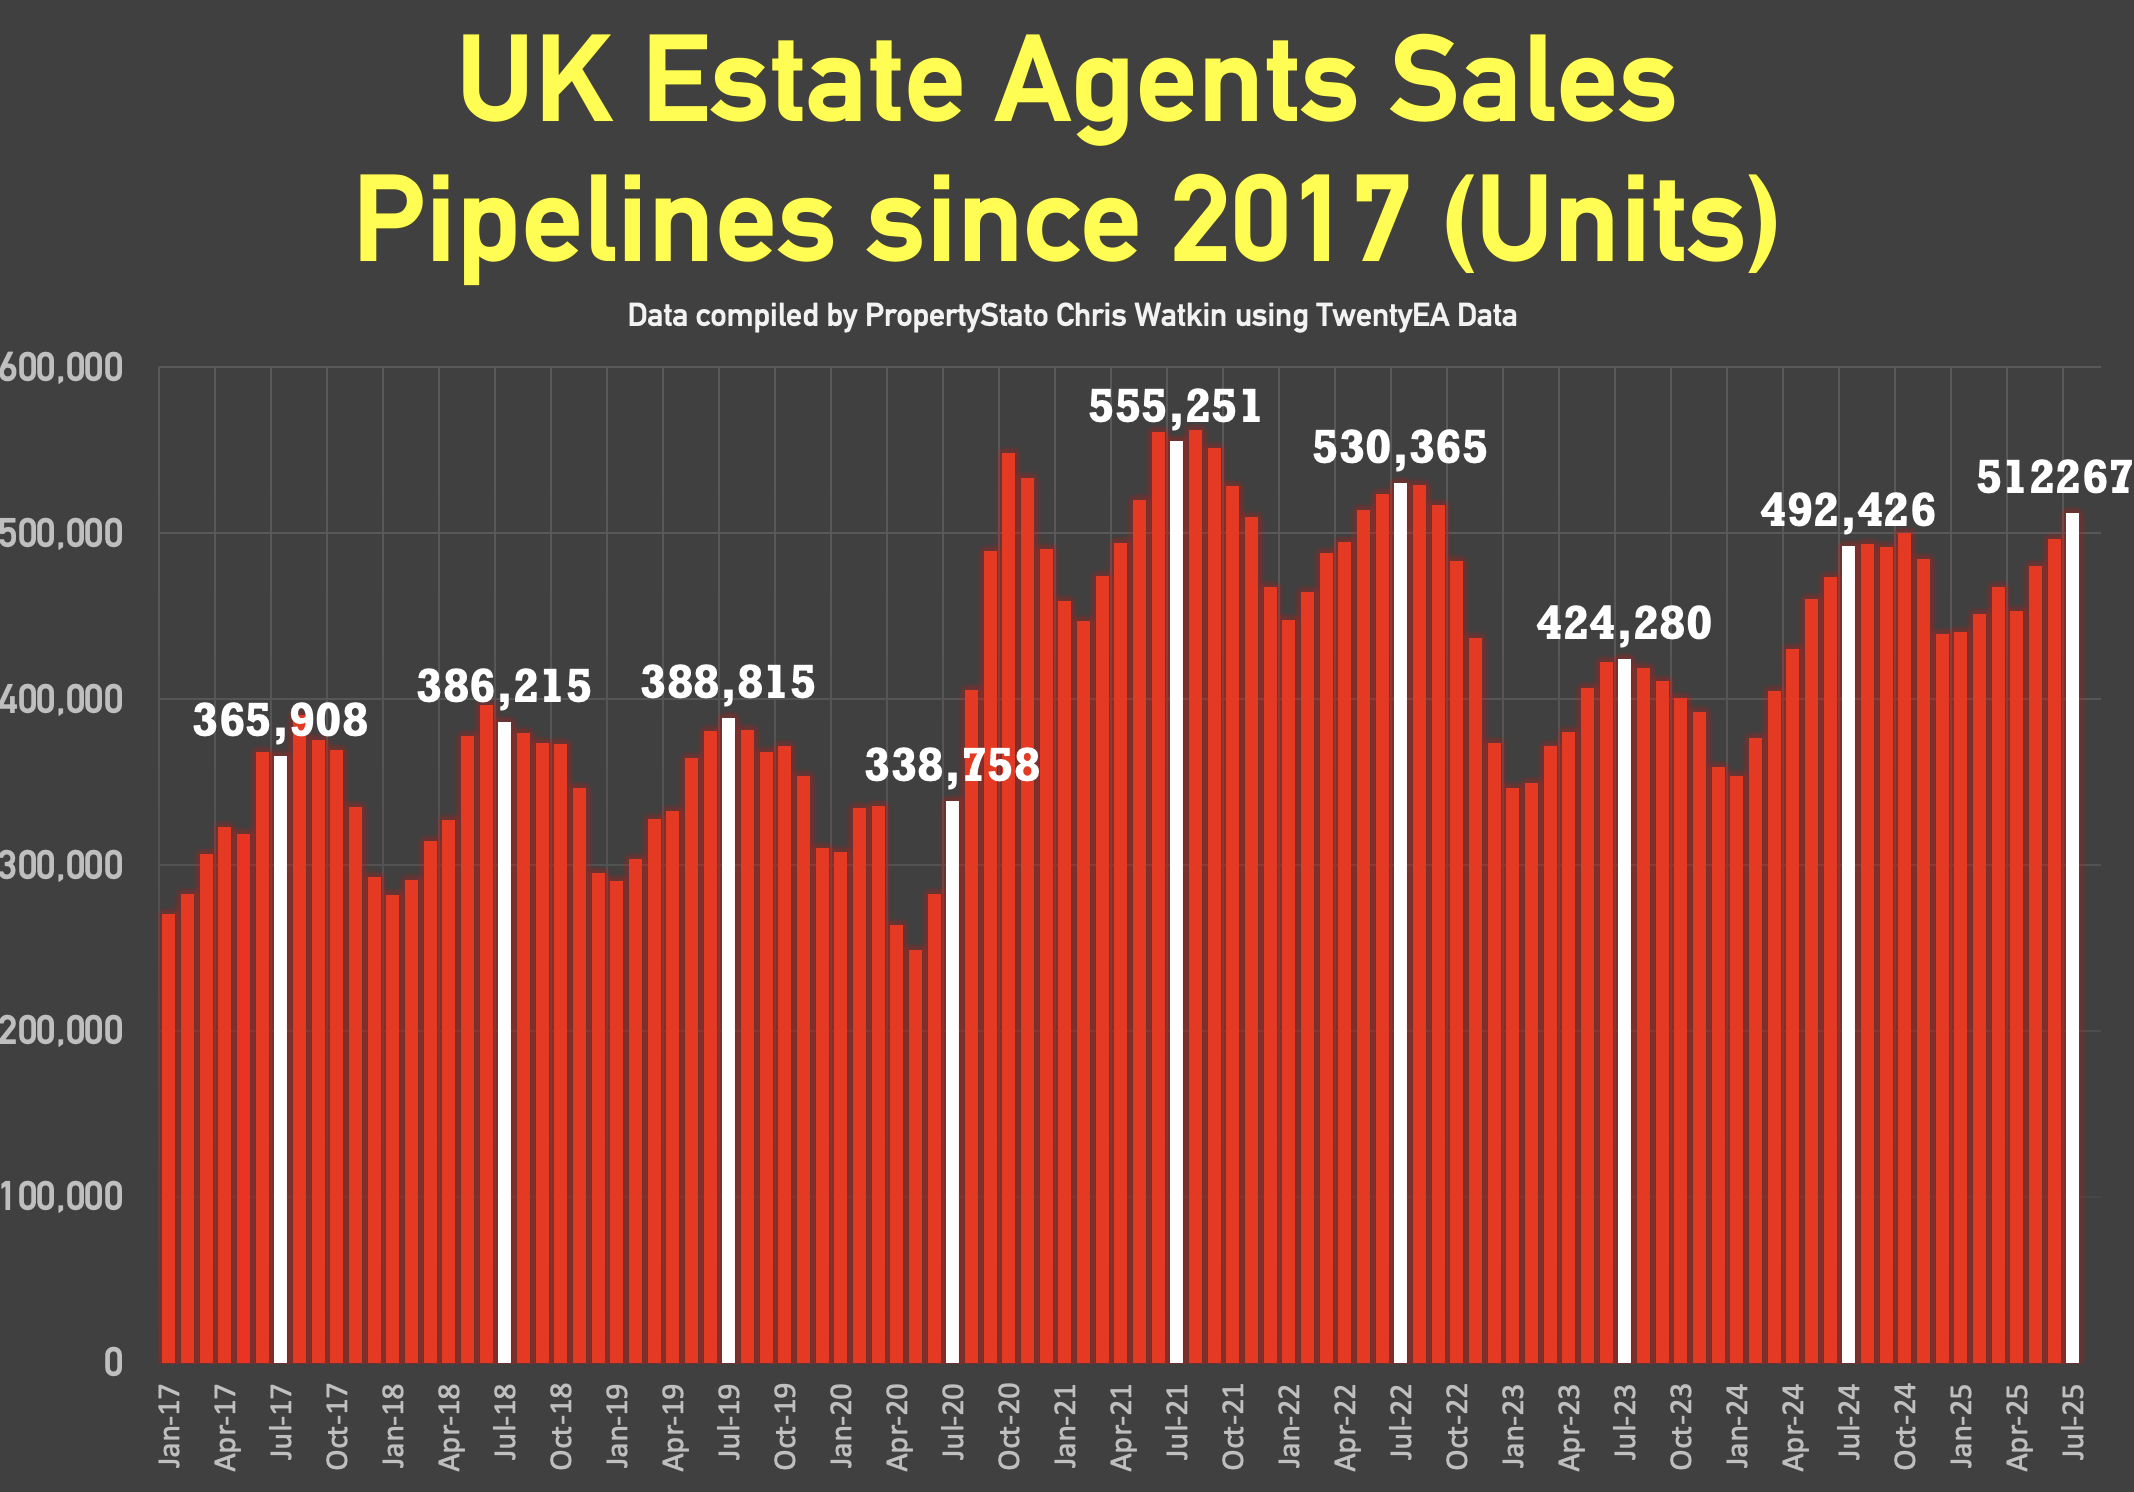
5,817 fall-throughs last week (from a 512k SSTC pipeline (units)).
Weekly average for 2025: 6,242
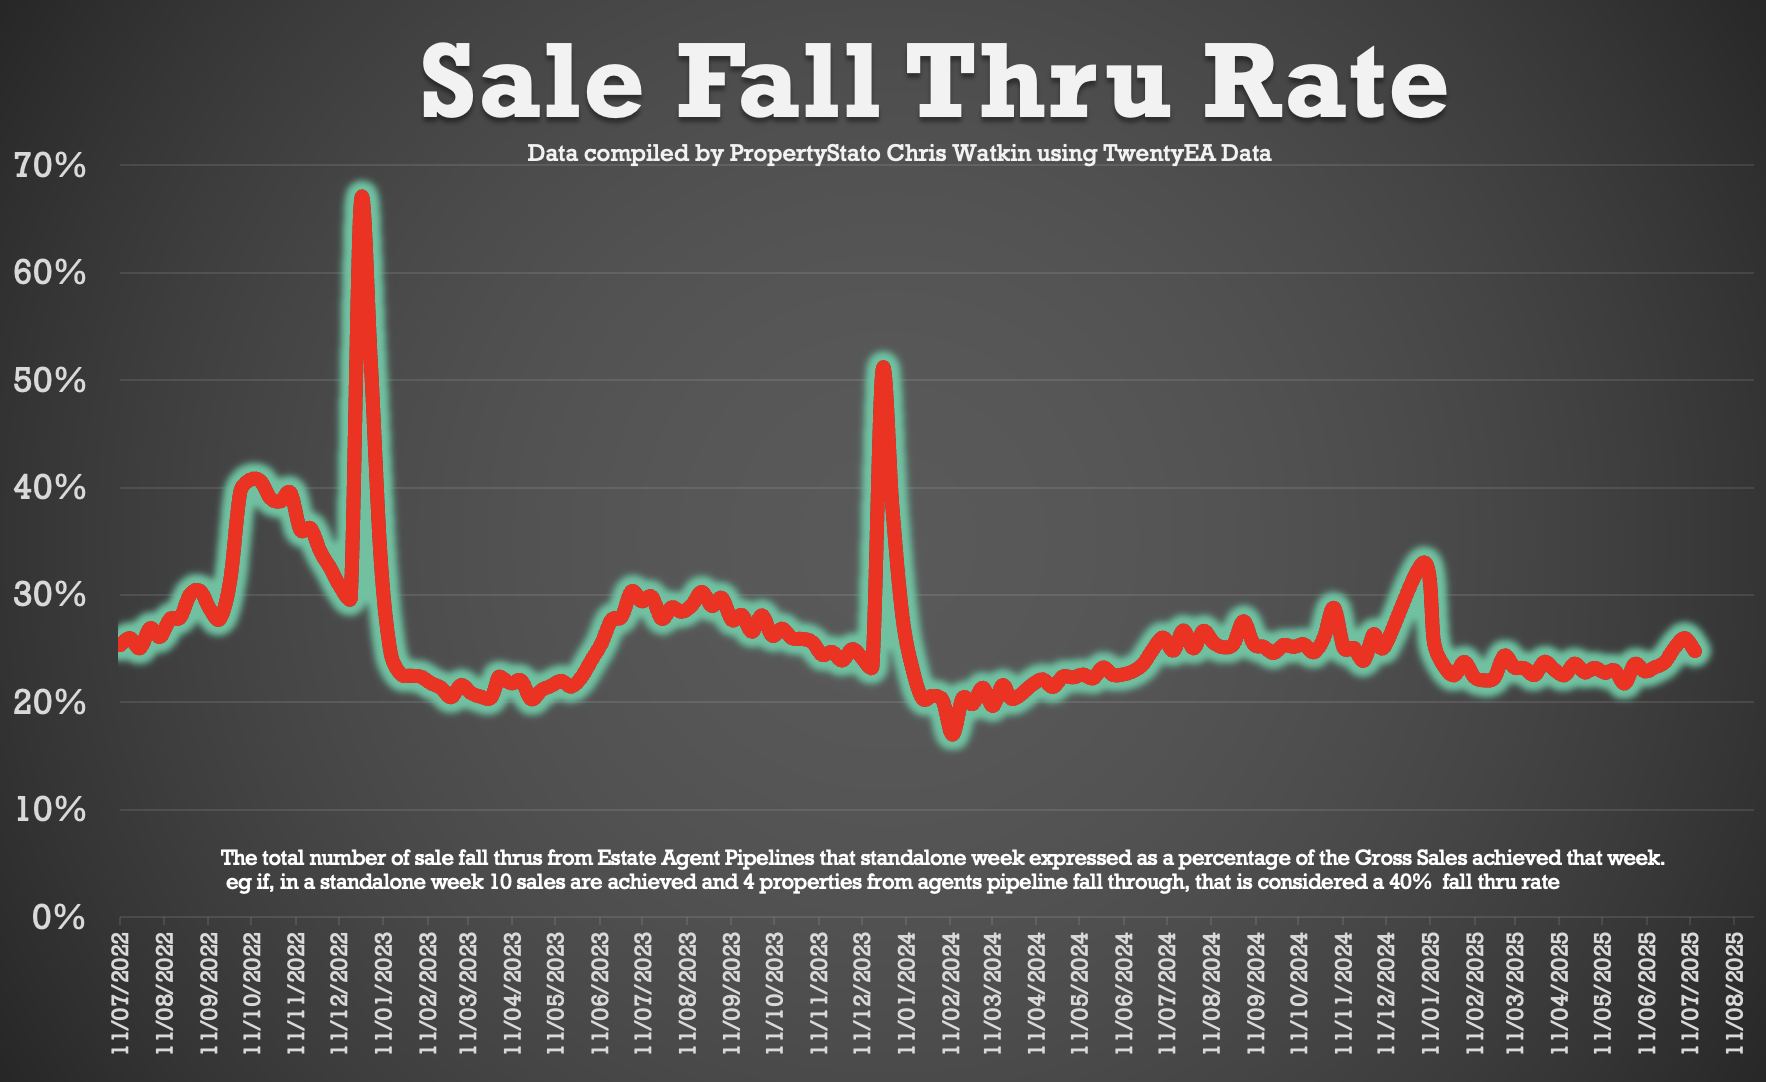
Fall-thru rate as percentage of gross sales: 23.2% (down from 24.4% last week).
The 9 year long-term average of 24.2% (post-Truss chaos saw that at levels of 40%+).

✅ Net Sales
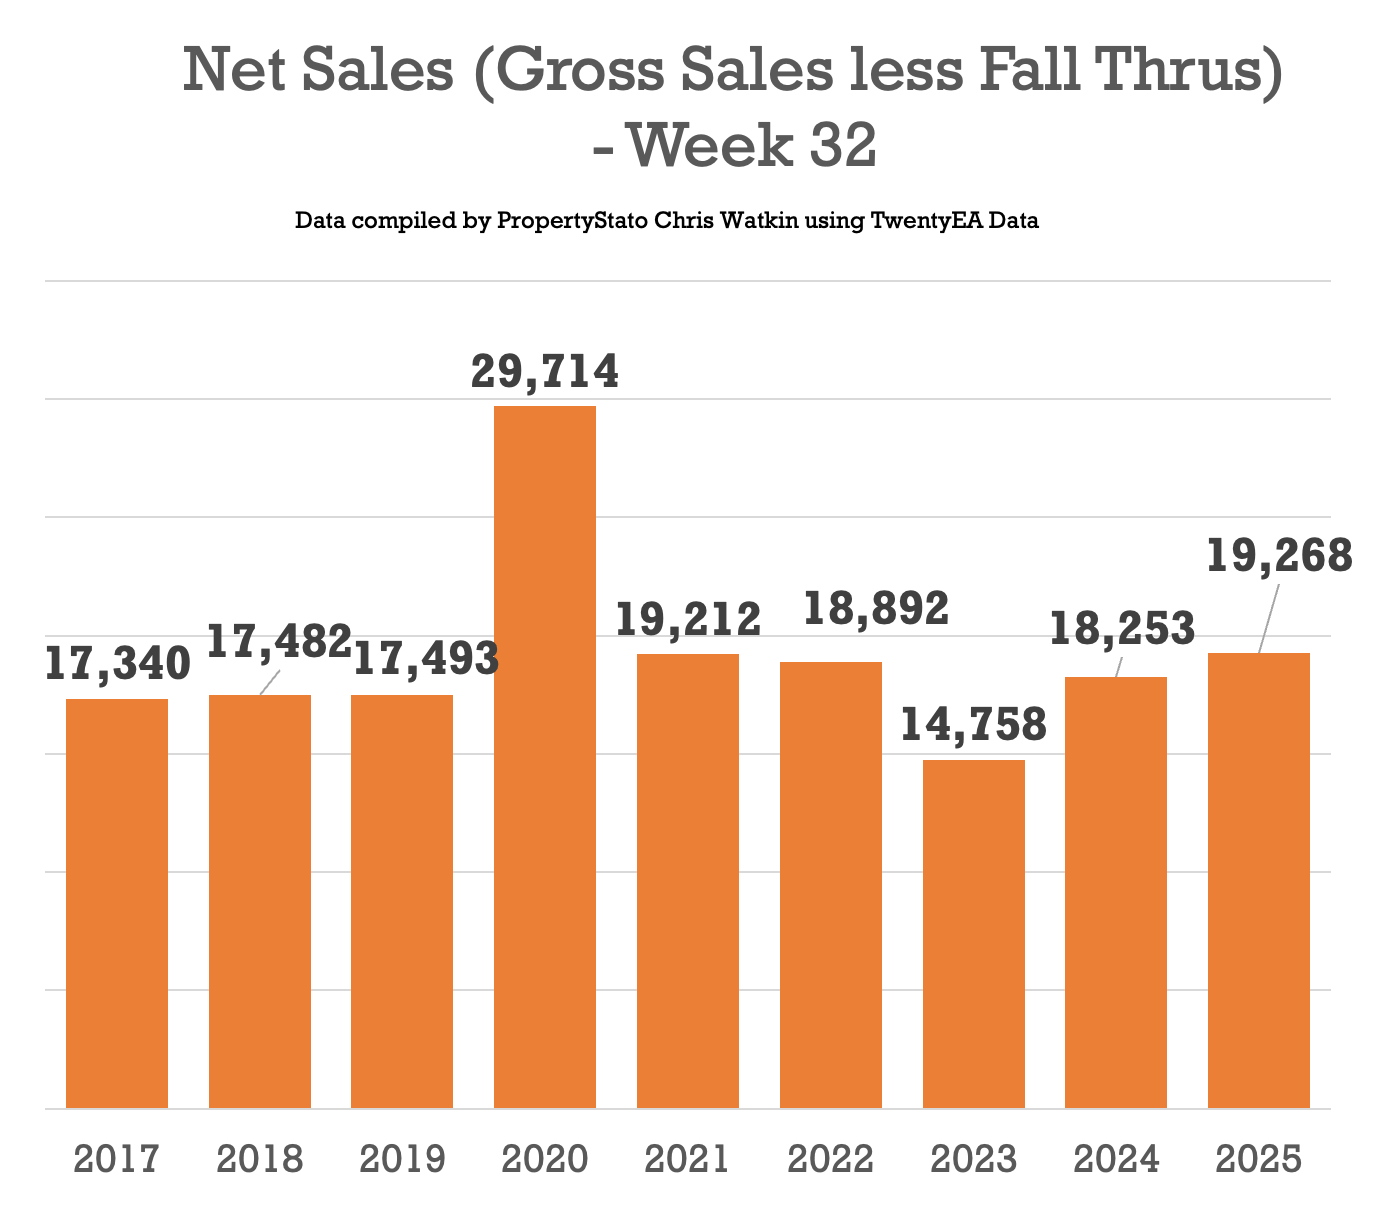
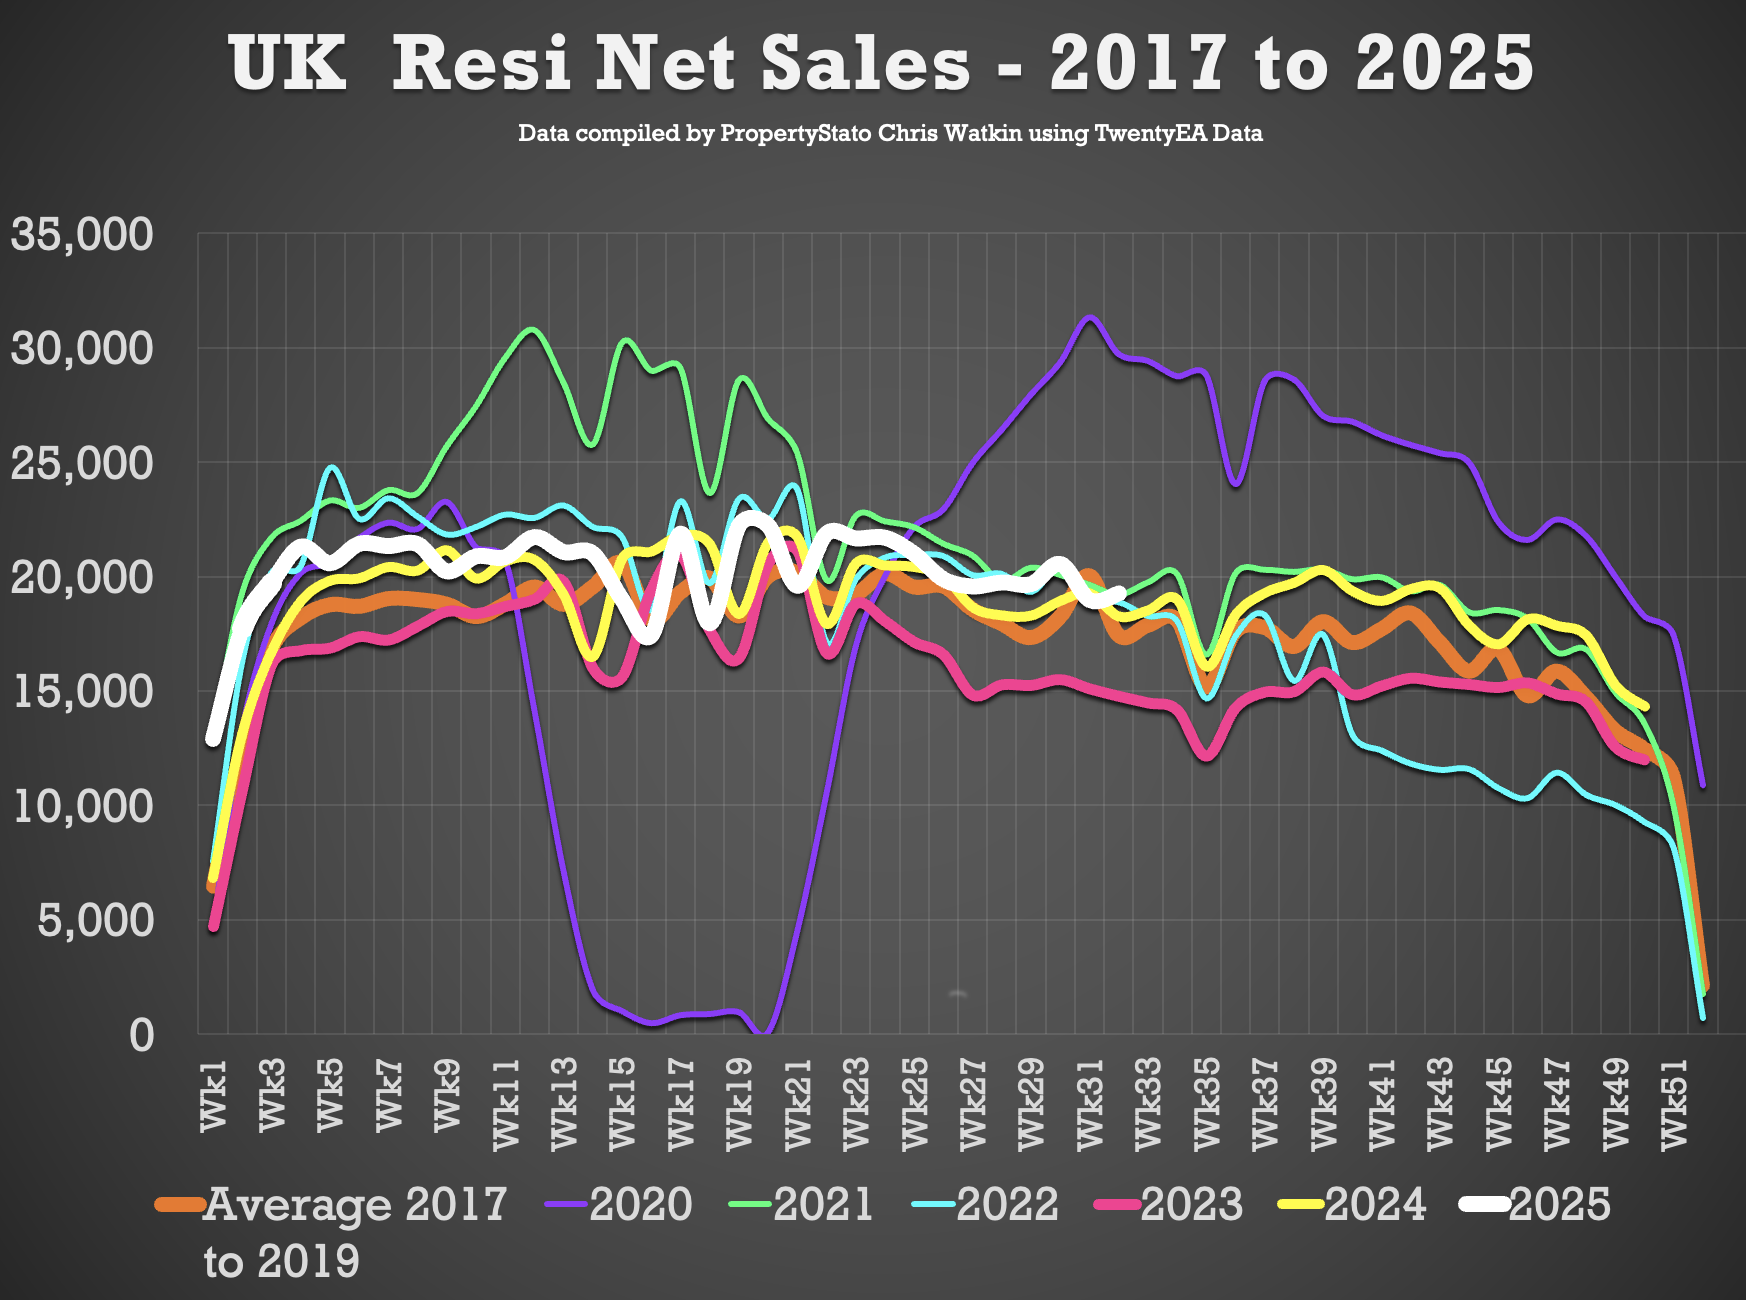
19.3k net sales this week (Up from 19k last week)
Weekly average for 2025: 20.2k
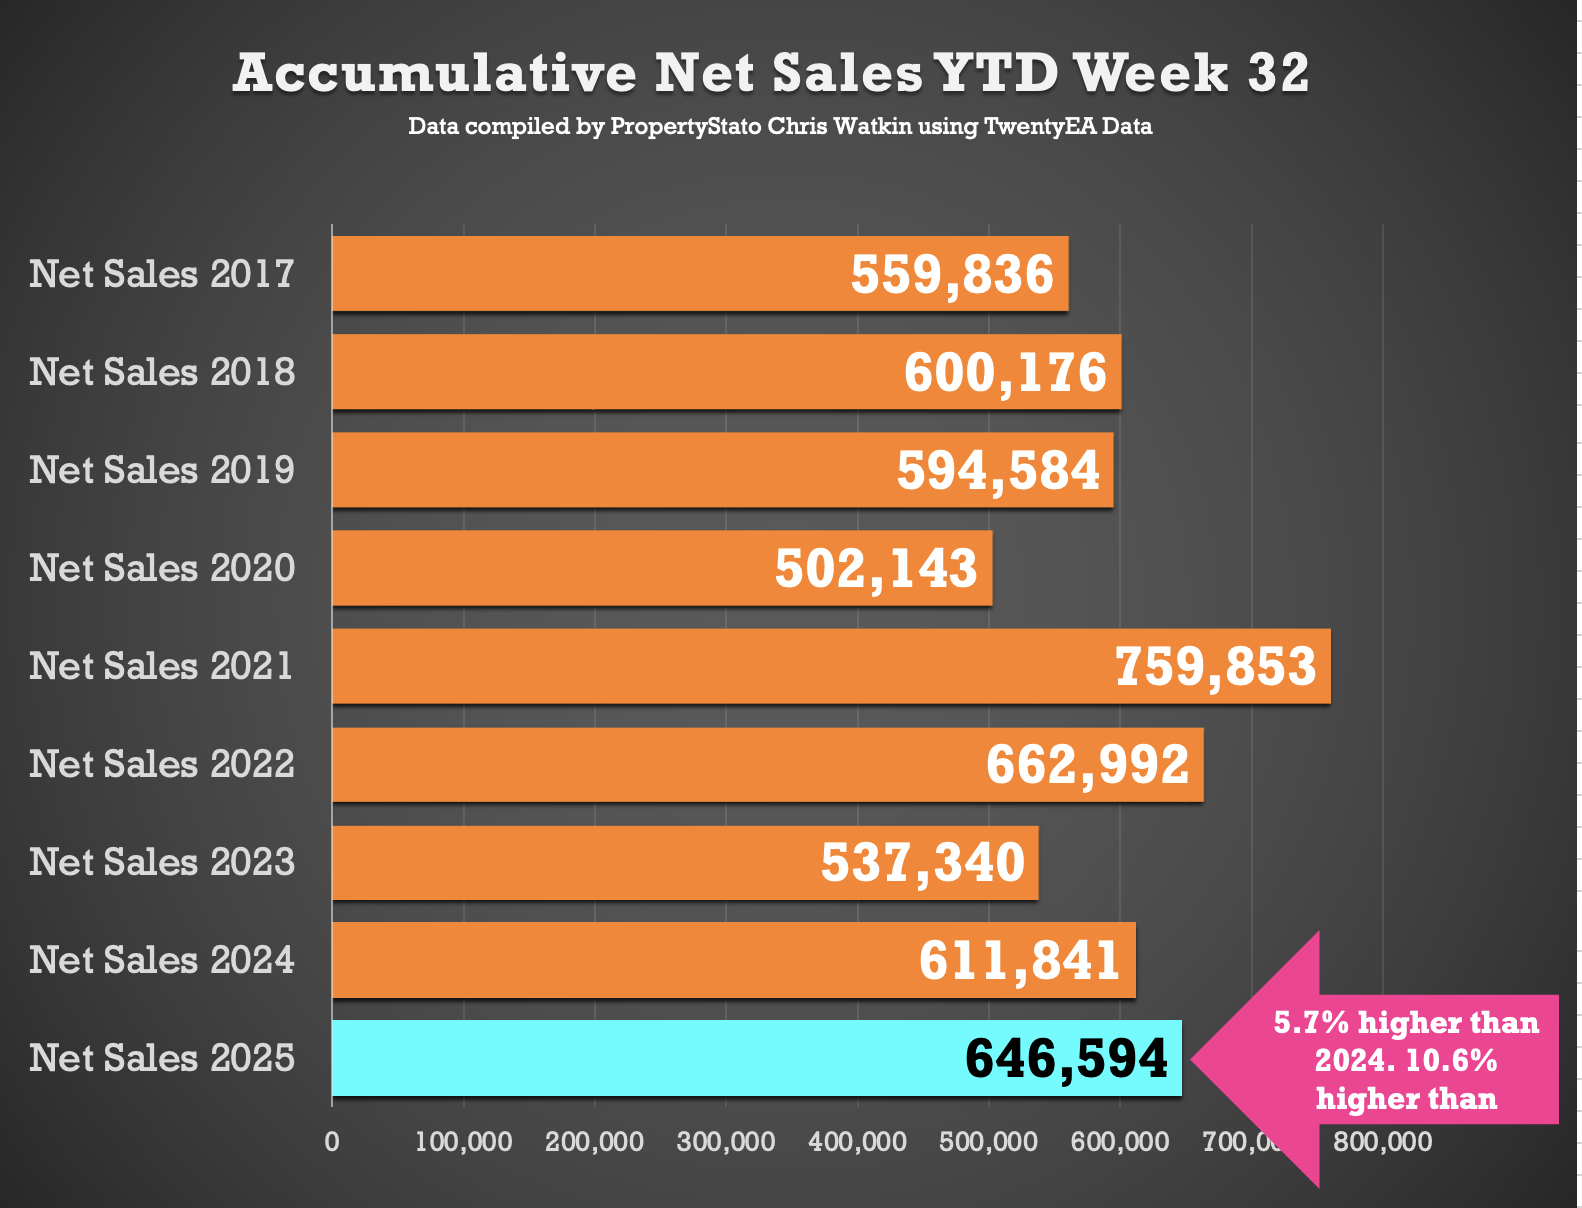
YTD Net Sales:
• 647k in 2025 which is 5.7% ahead of 2024 YTD figure of 611k and 10.6% up on 2017–19 YTD (584k).
✅ % Chance the Home will Sell (month in arrears)
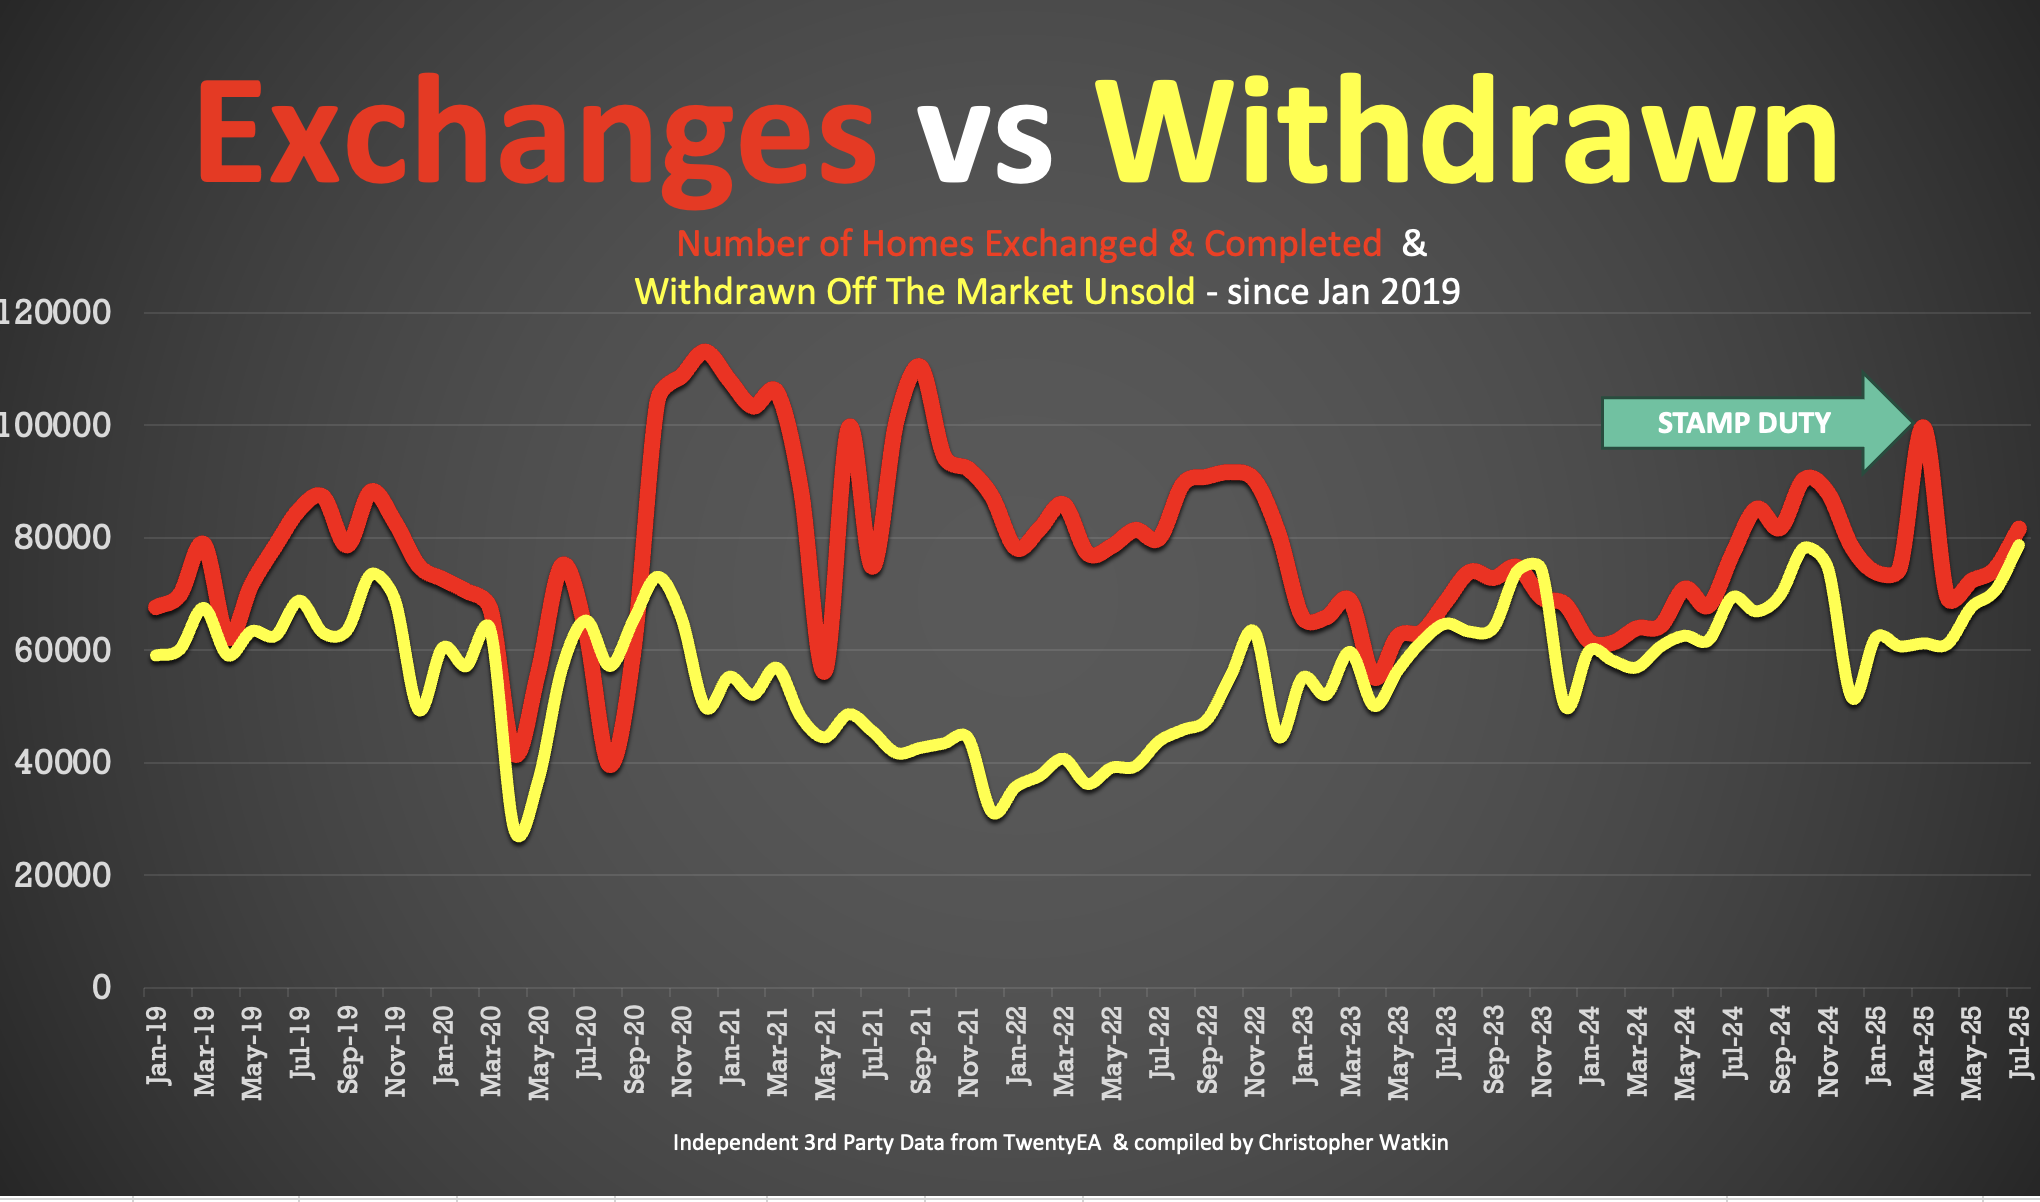
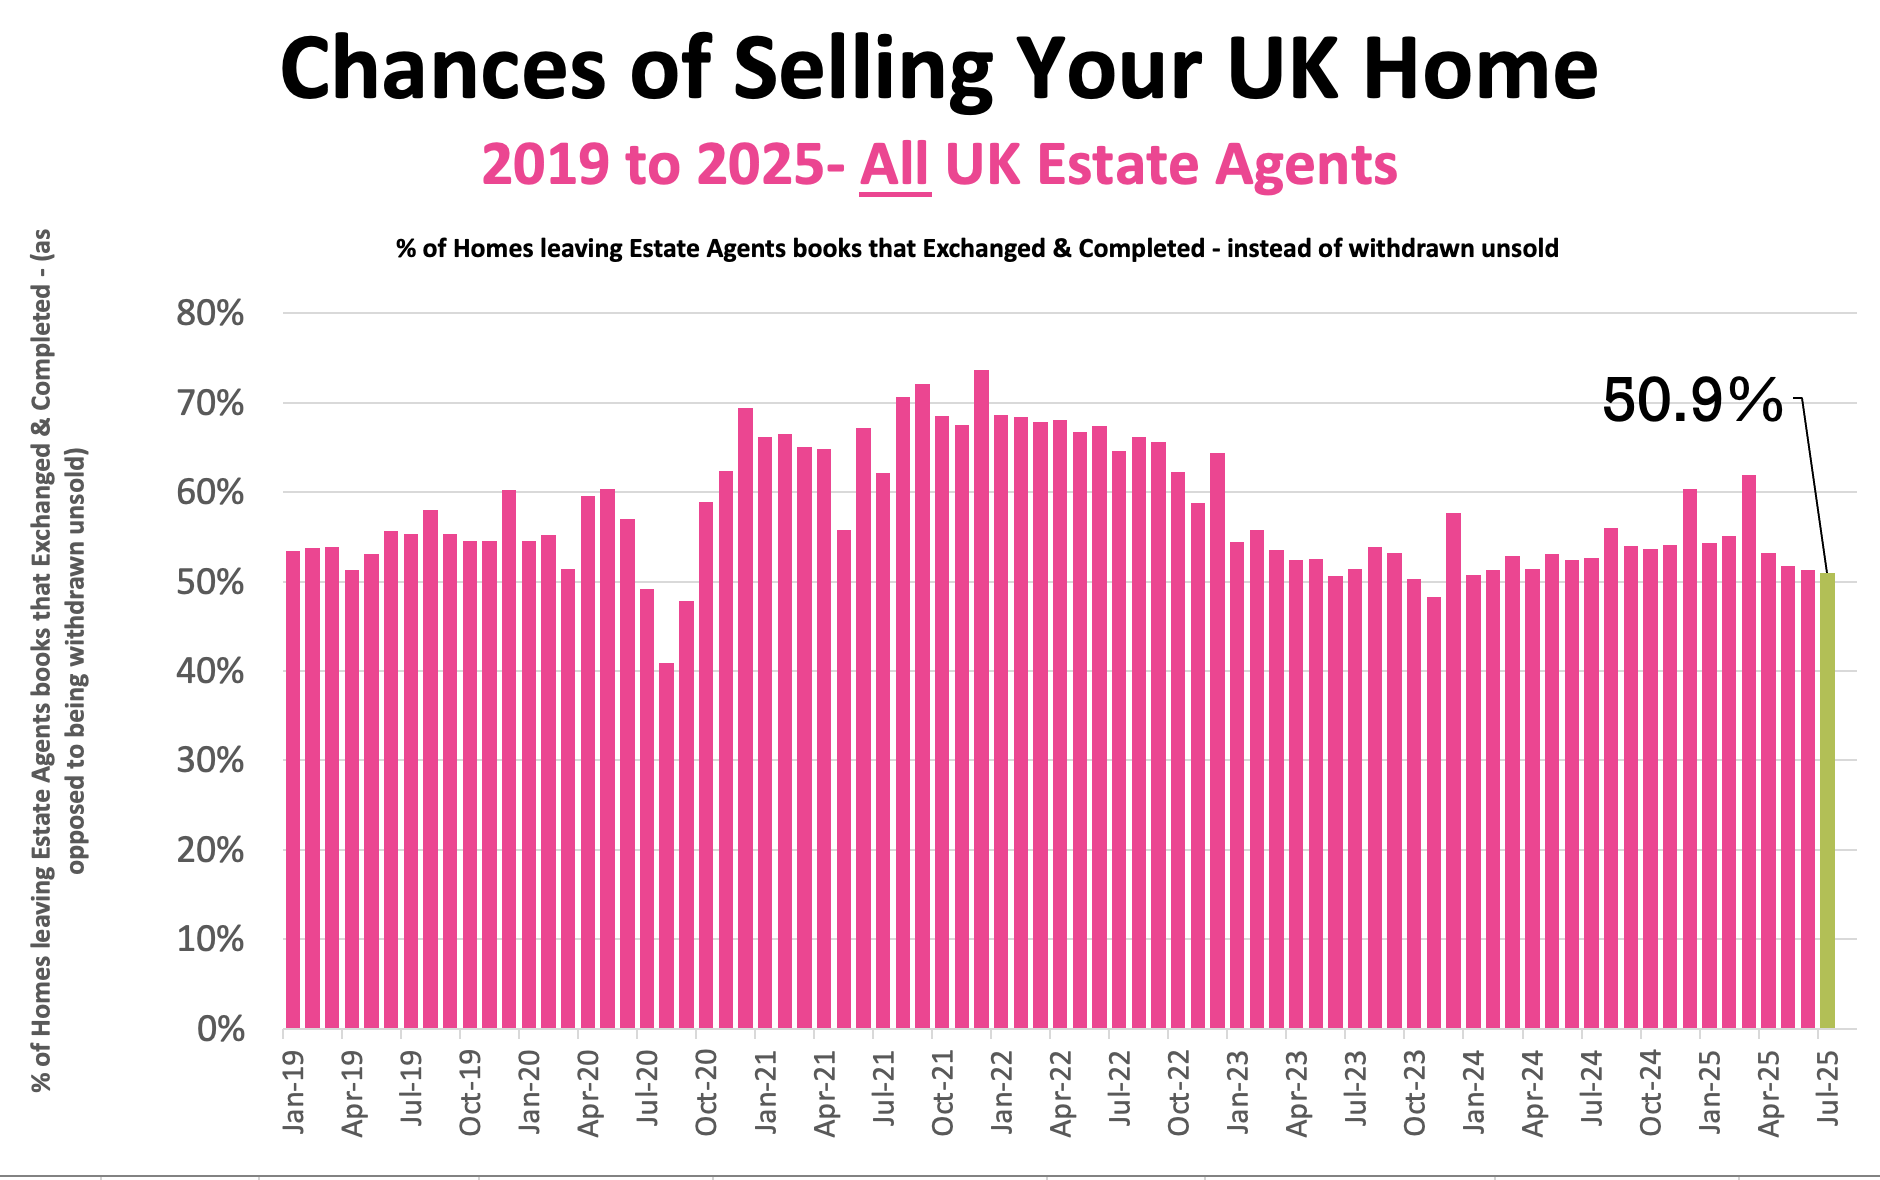
July stats showed 50.9% of UK Homes that left the estate agents books in exchanged & completed contracts (ie the agent got paid and the home moved on completion), the remaining 49.1% left Estate Agent books, unsold and homeowner staying in their home.
Comparison
Jun – 51.3%
May – 51.7%
April – 53.2%
NB – this July stat will change throughout August as more data comes through.
✅ Stock Levels (For Sale and Sales Pipeline) – 1st of the Month
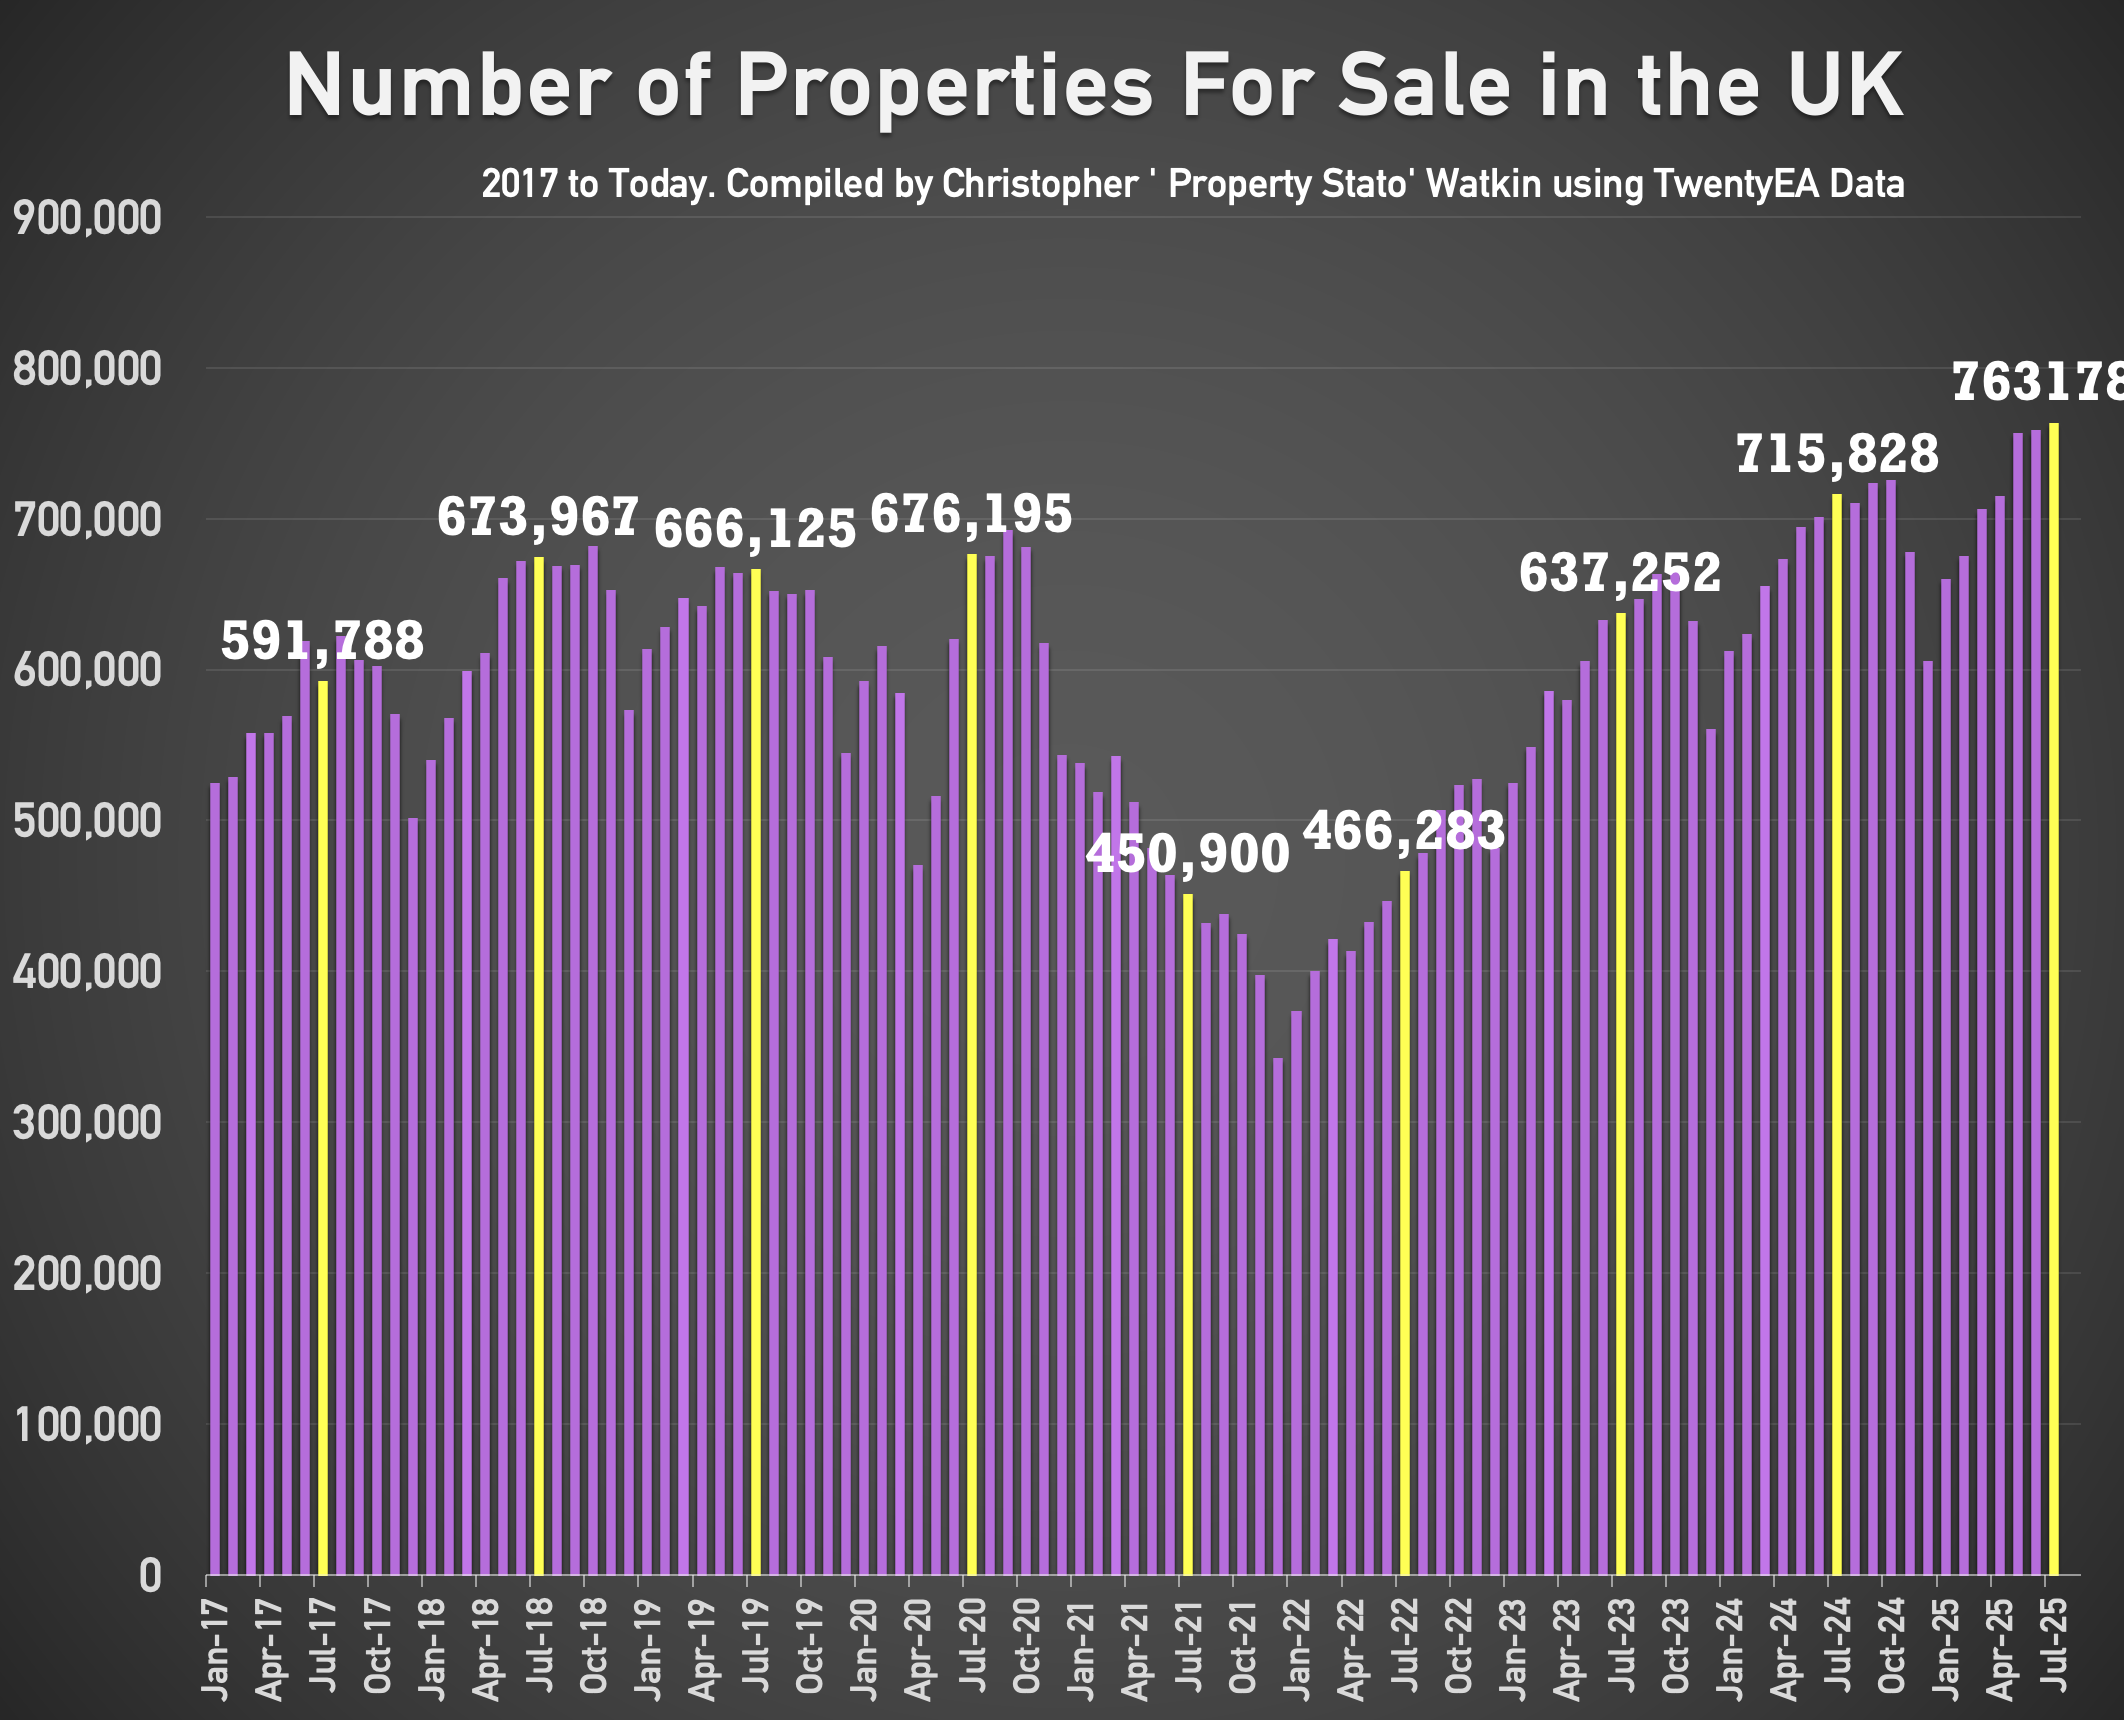
763k homes on the market at the start of 1st August – 6.7% higher than 1st August 2024 (715k).
512k homes in Estate Agents sales pipelines on 1st August – 4% higher than than 1st August 2024.
✅ House Prices (measured by £/sq.ft)
£344.78/sqft on Sales Agreed in July 2025 – 1.97% higher than July 2024 and 3.85% higher than July 2022.
✅ Rental Stats (in arrears)
July 2025 with an average rent of £1,876 pcm (July ’24 – £1,863 pcm)
(YTD 2025 average is £1767 pcm).
✅ Local Focus:
Bournemouth
Daily news email from EYE
Enter your email below to receive the latest news each morning direct to your inbox.