


 Welcome to the 36th UK Property Market Stats Show of 2025, your weekly TV programme on the UK housing market.
This week, I am joined by Rob Smith, boss man of Hunters, Whitegates & Northwood as we unpack the key headlines for the week ending Sunday 14th September 2025 .
🔍 Key Market Headlines – Week 36, 2025
✅ New Listings
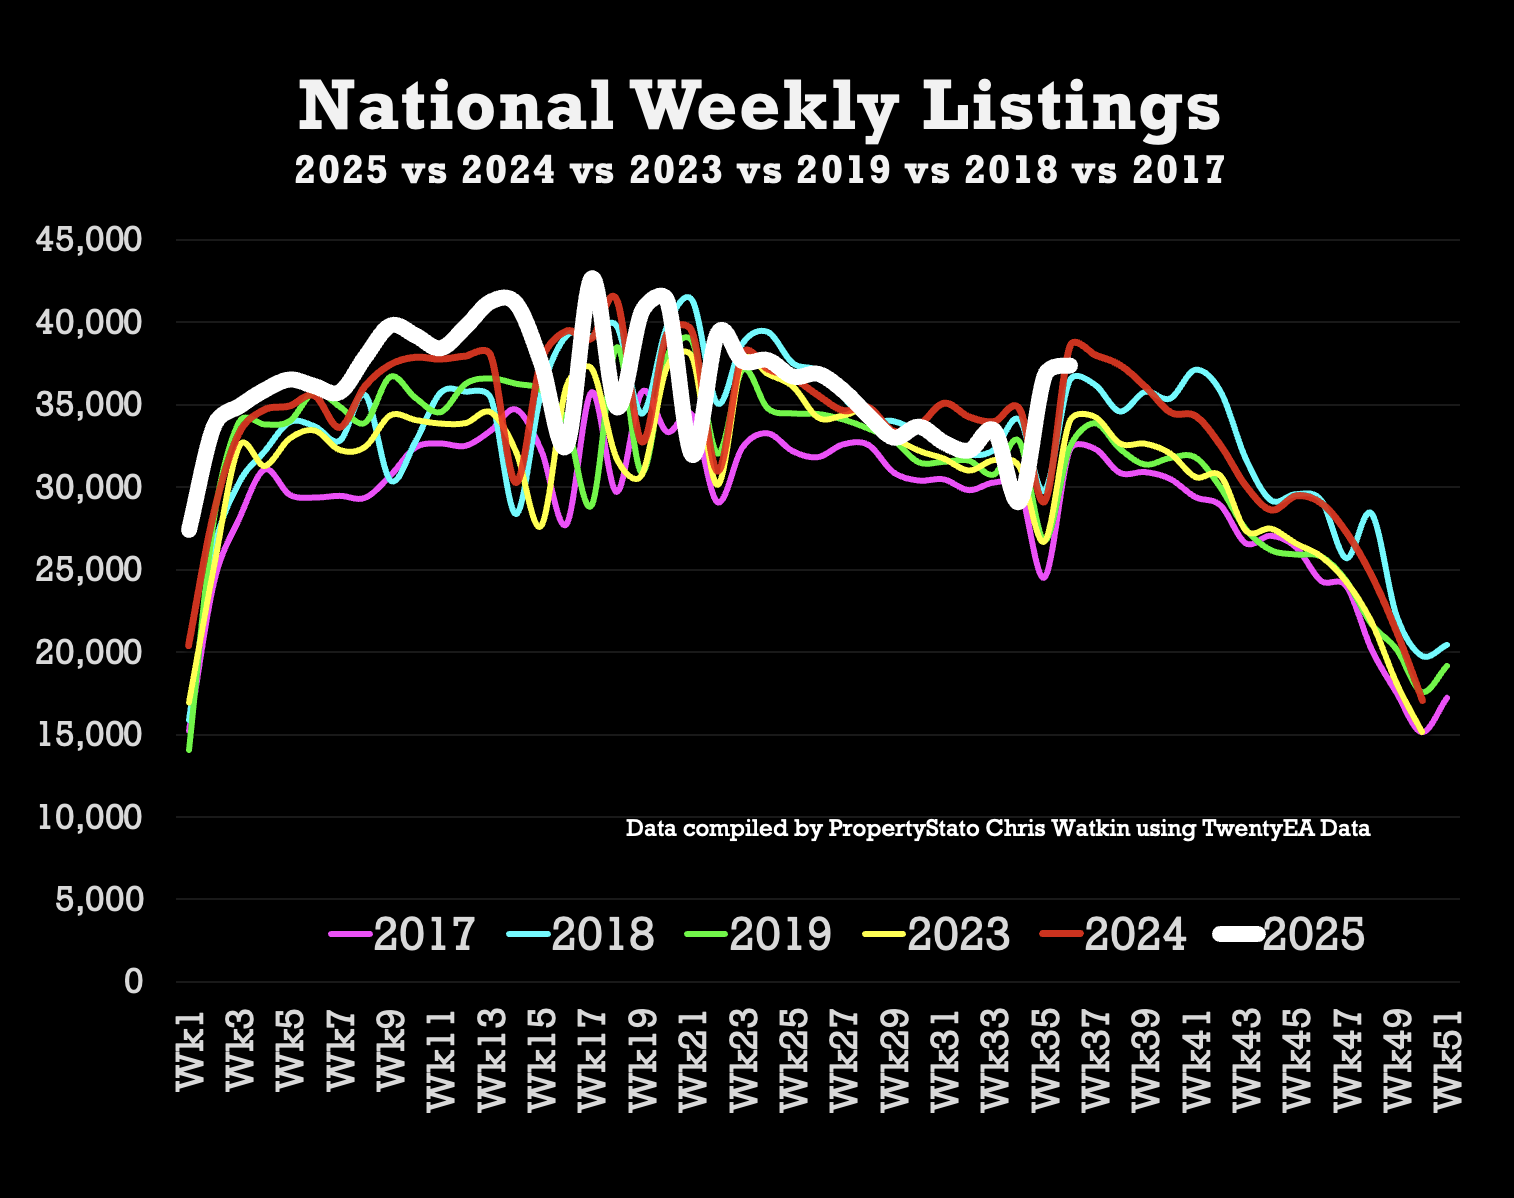
- 37.4k new homes came to market this week, up from 36.8k last week.
- 2025 weekly average: 36.2k.
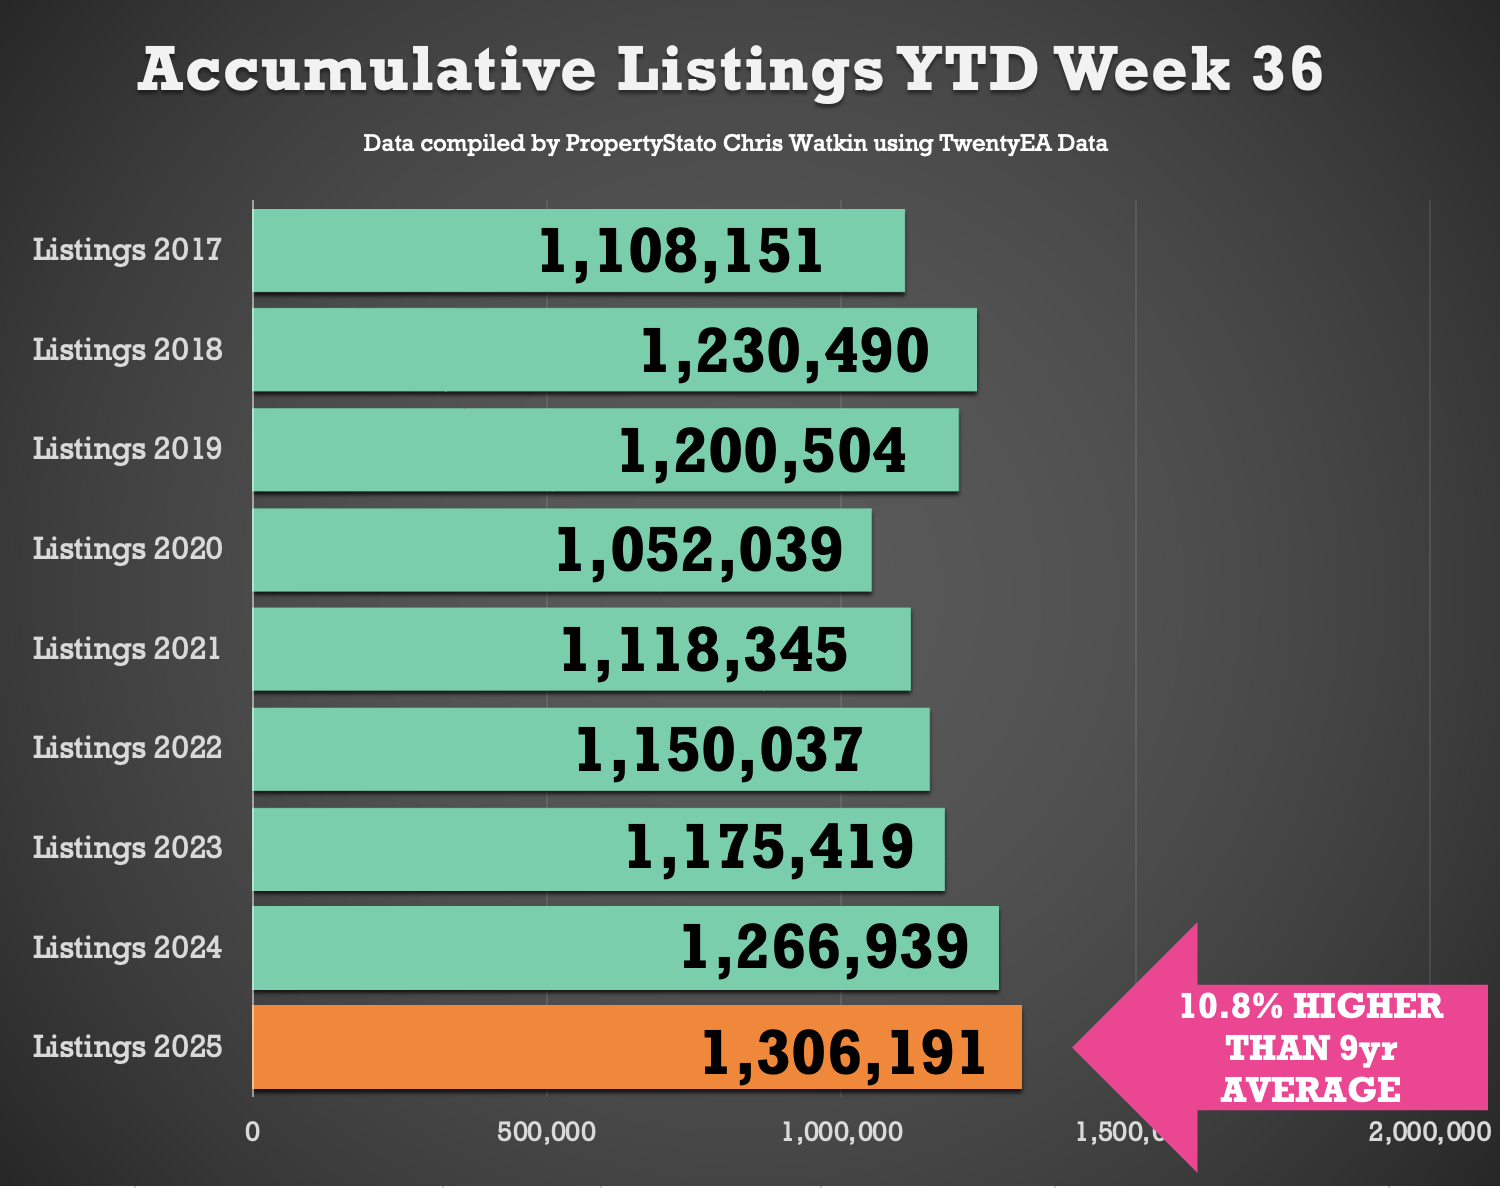
- Year-to-date (YTD): 1.30m new listings, 3.1% higher than 2024 YTD and 10.7% above the 2017–19 average.
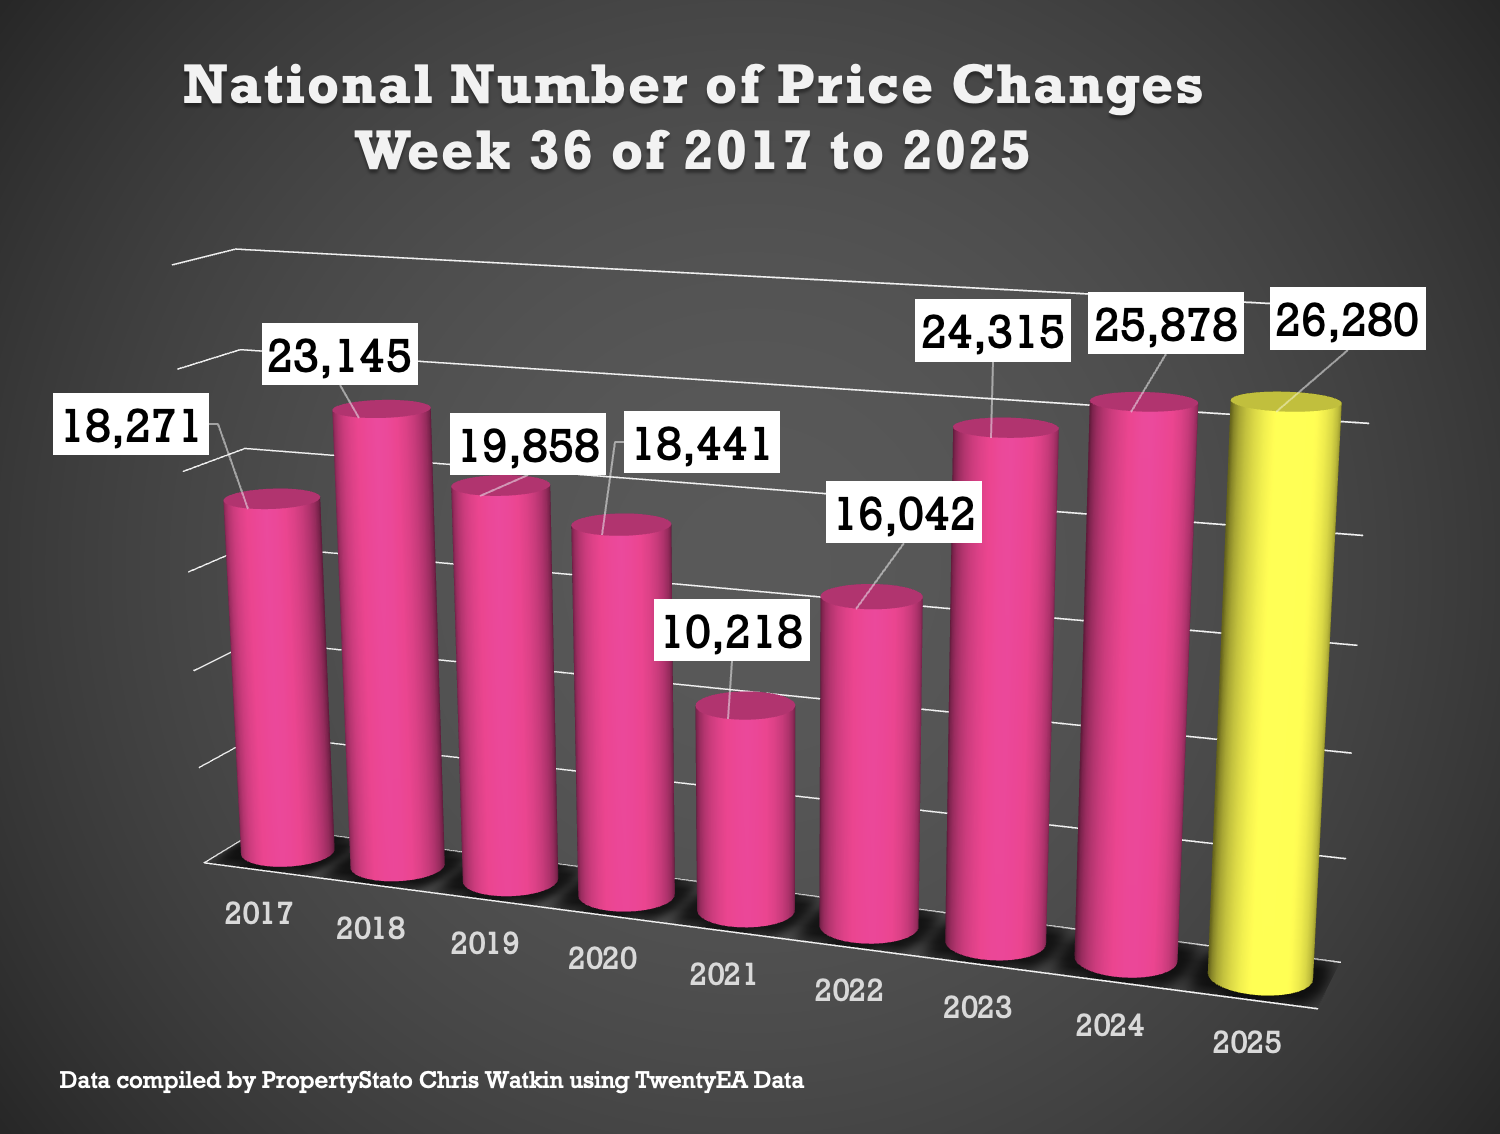
✅ Price Reductions
- 25.6k reductions this week, similar to last week at 25.7k.
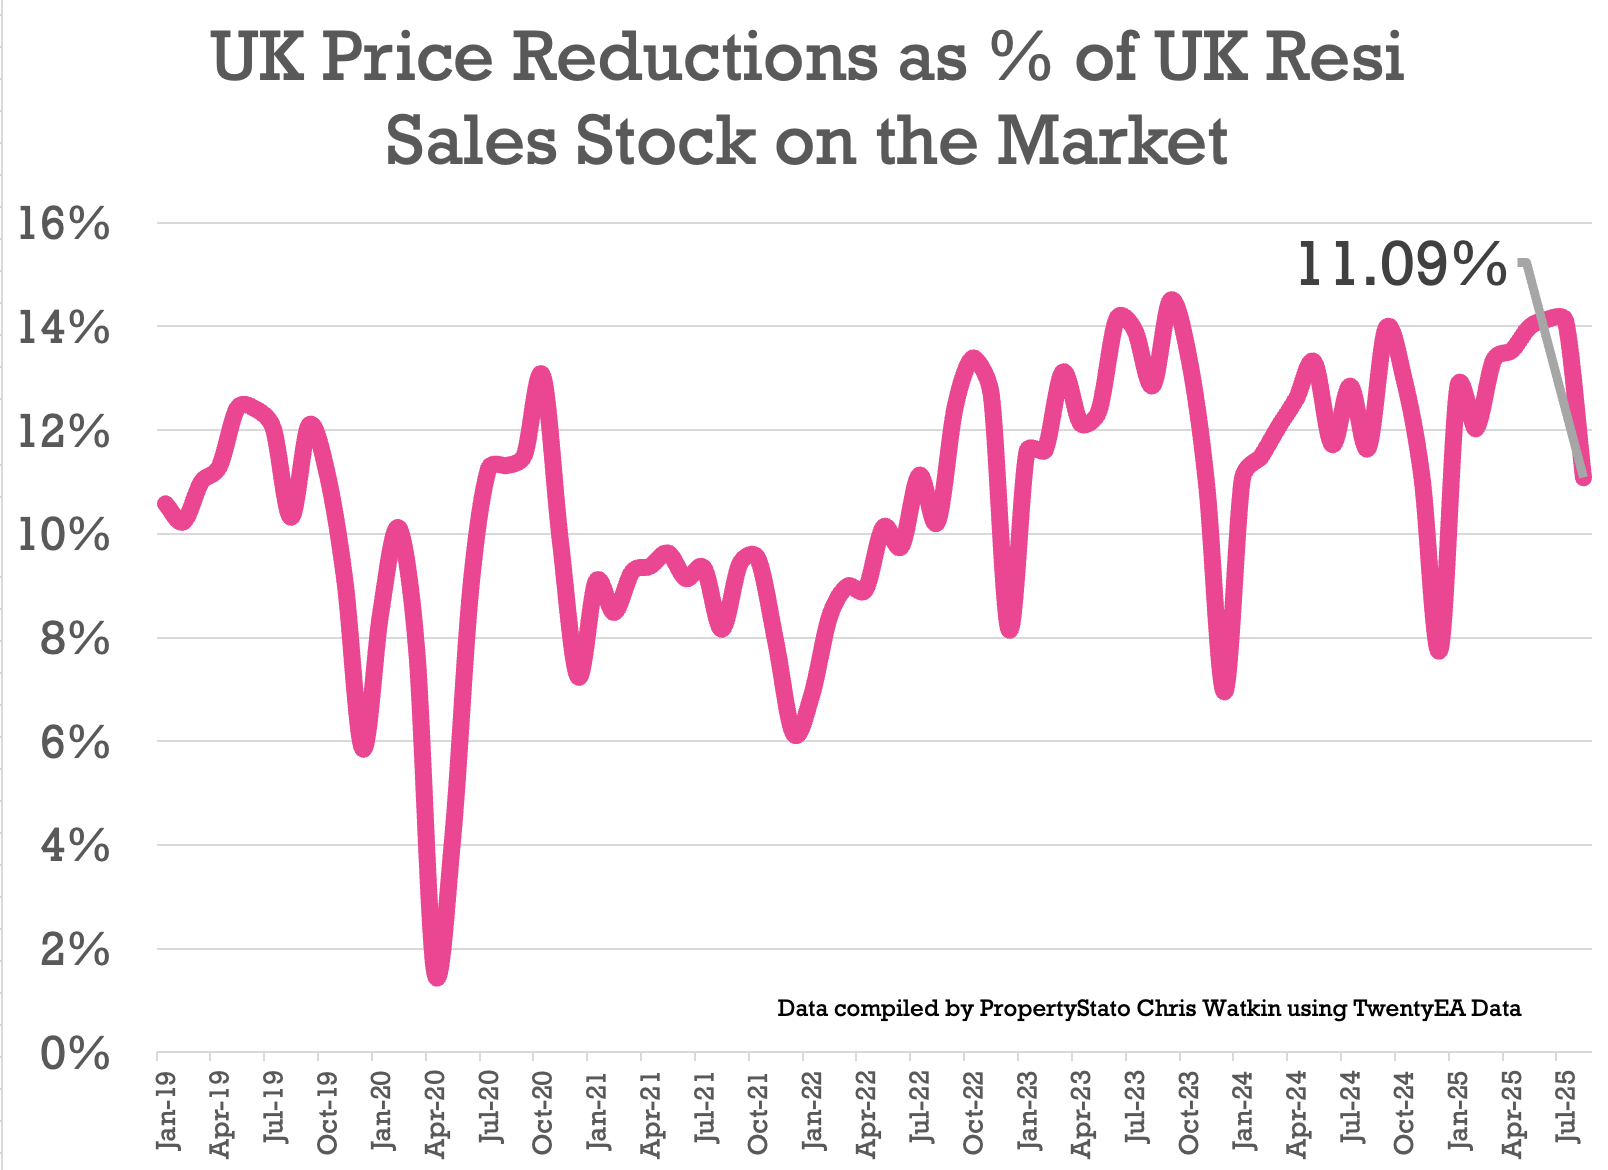
- Only 11.1% of homes were reduced in August, compared with 14.1% in July and 14% in June.
- 2025 average so far: 13.1%, versus the five-year long-term average of 10.7%.
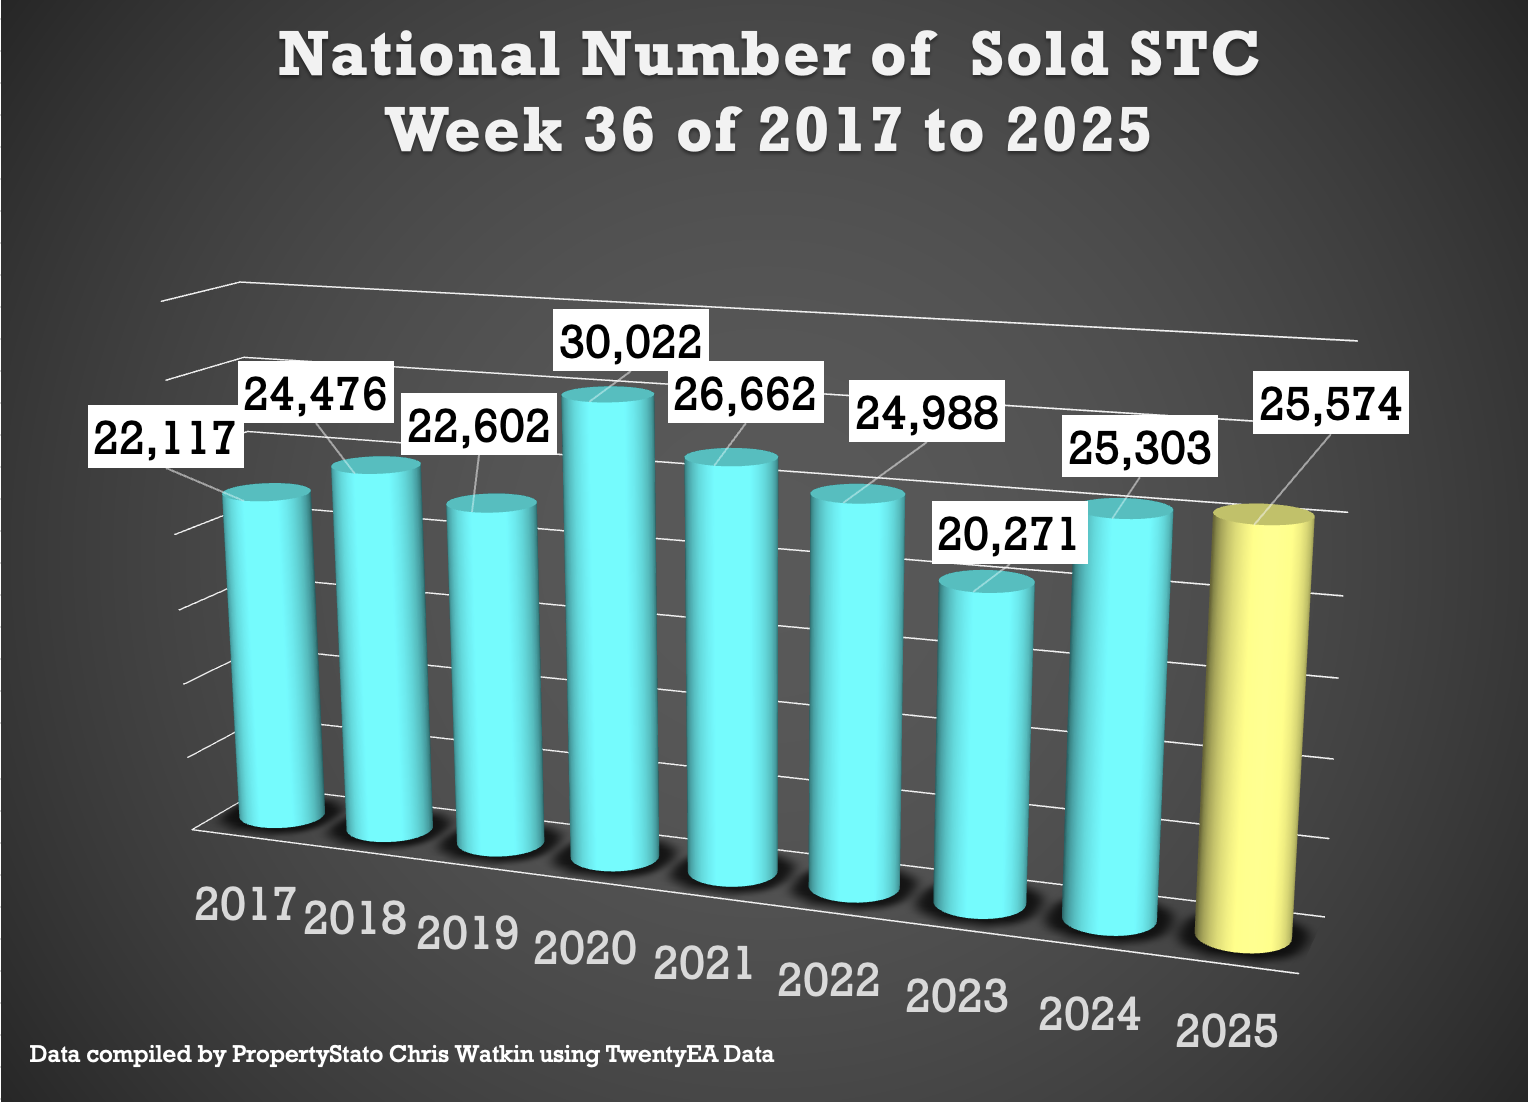
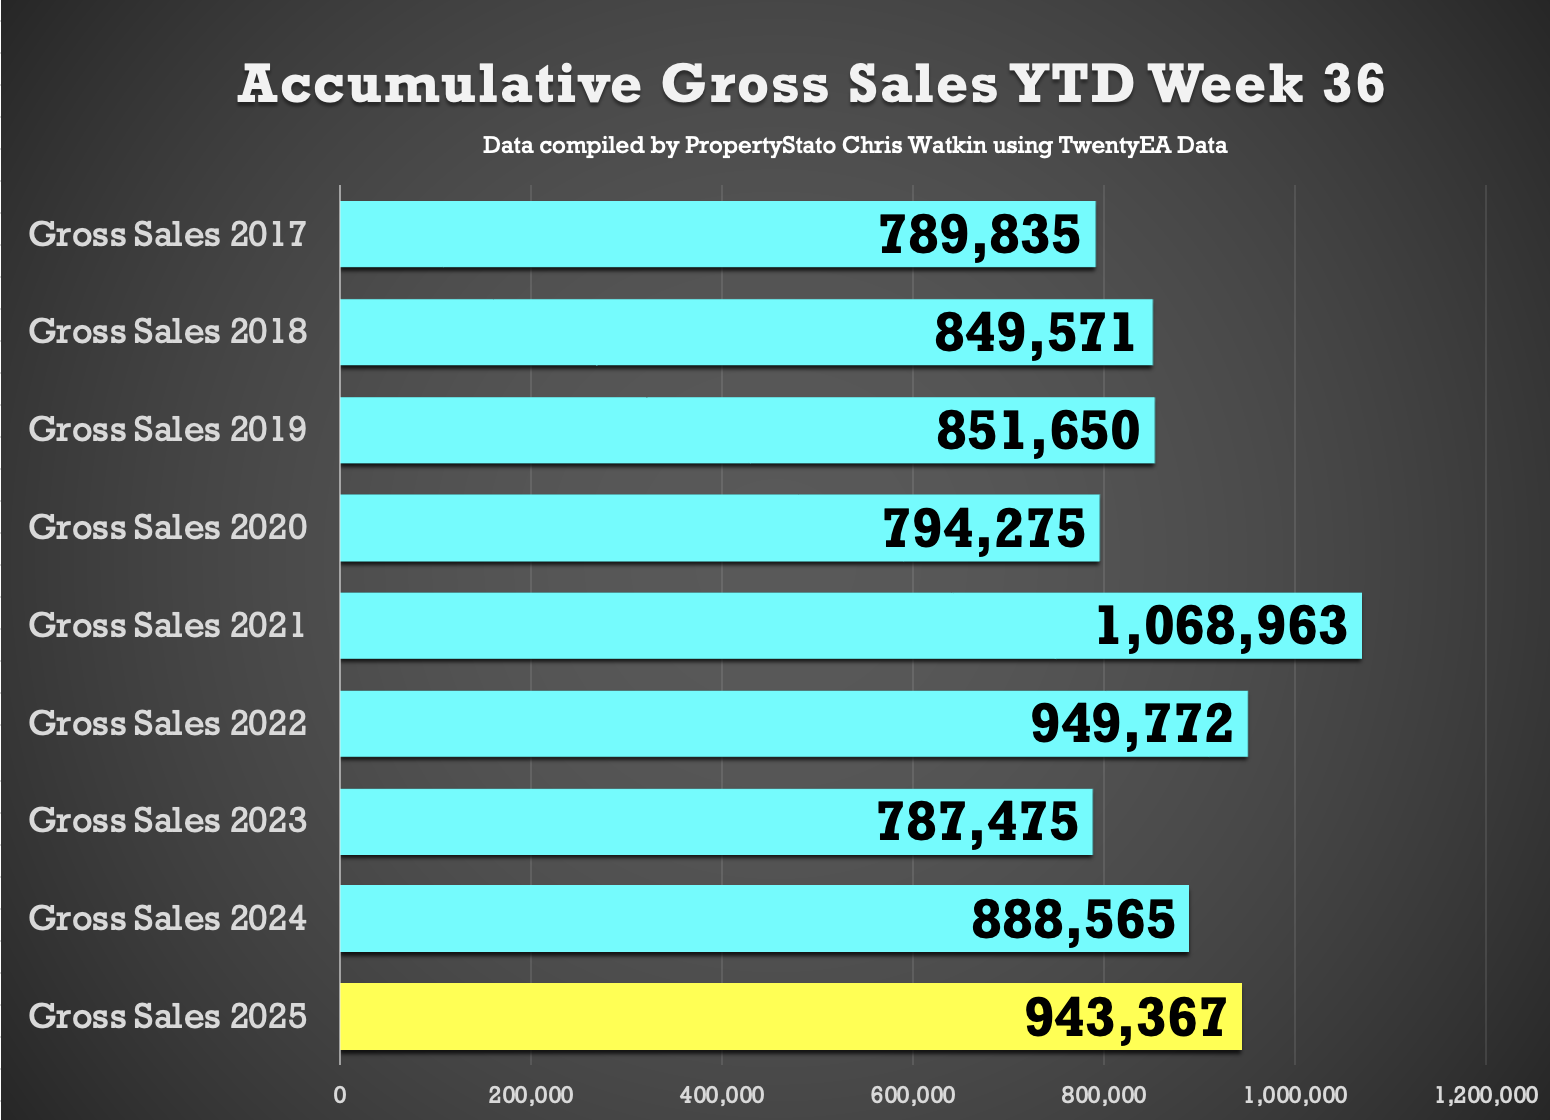
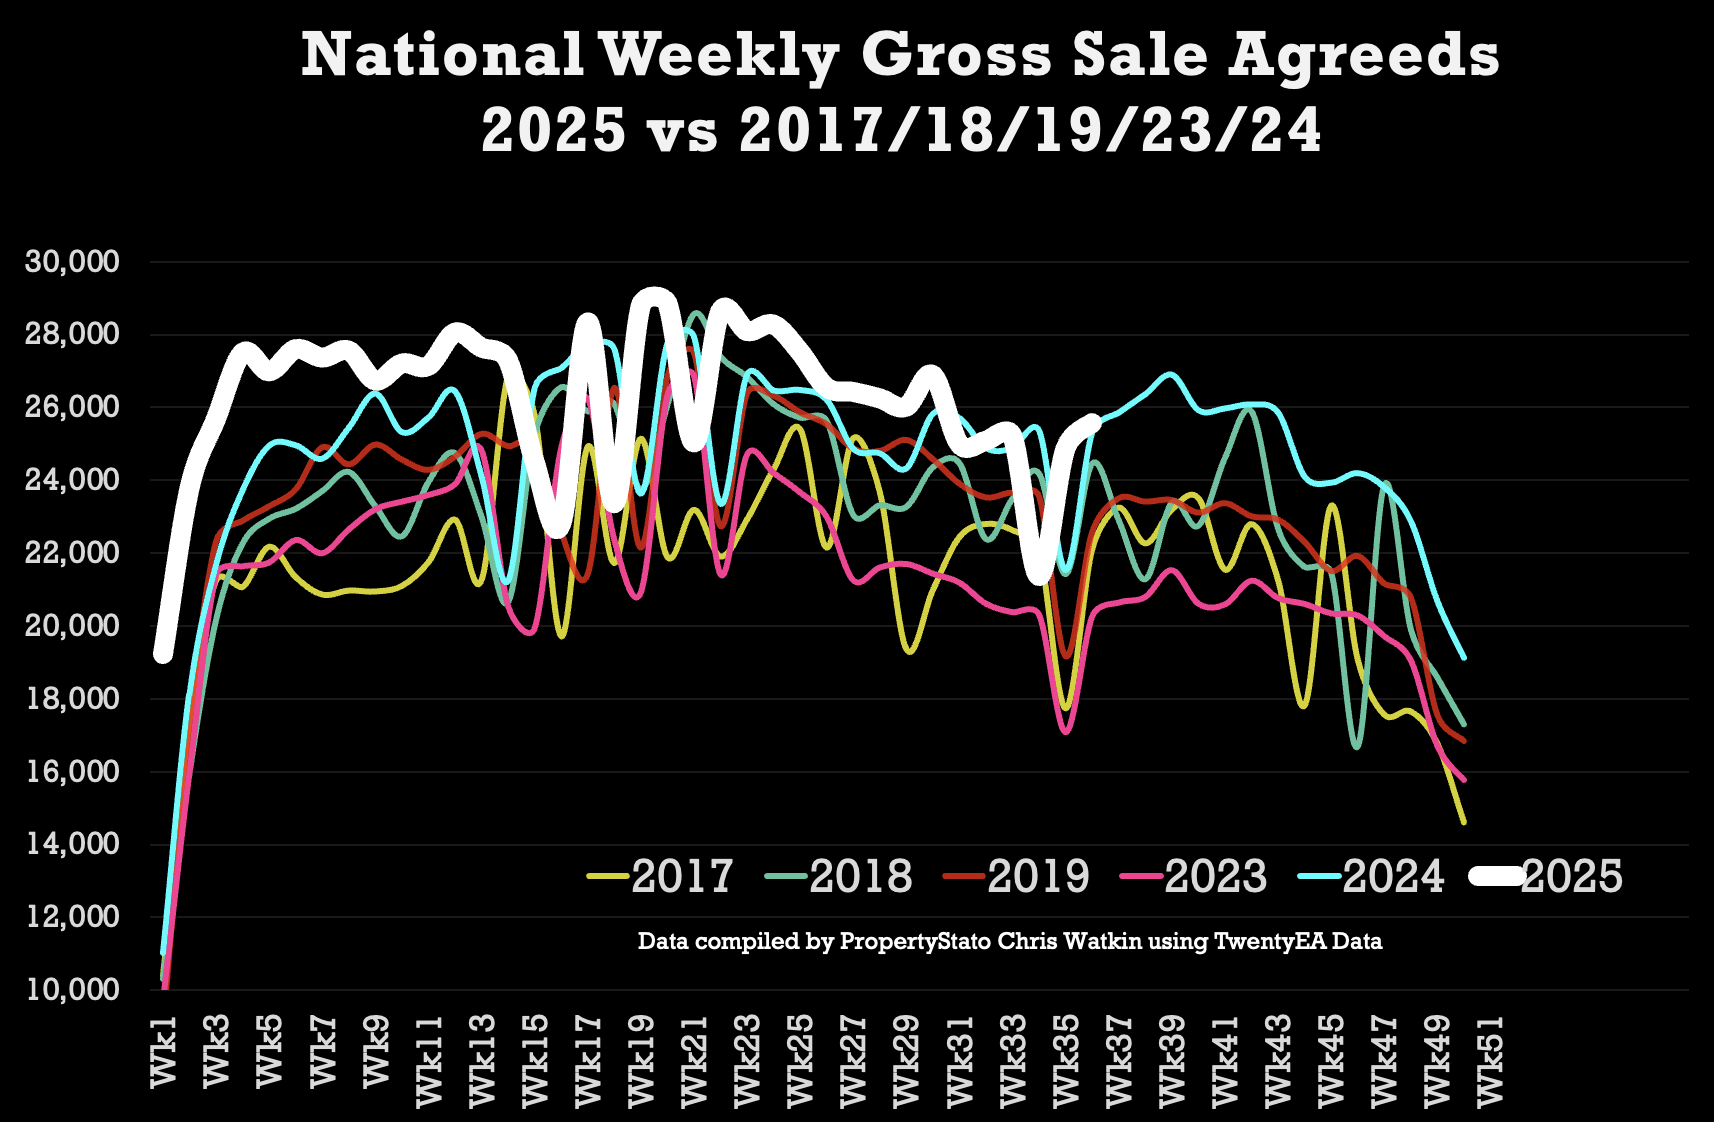
✅ Sales Agreed
- 25.6k homes sold subject to contract this week, up from 24.9k last week.
- Weekly average for 2025: 26.2k.
- YTD: 943k, which is 6.2% ahead of 2024 and 13.6% above the 2017–19 average.
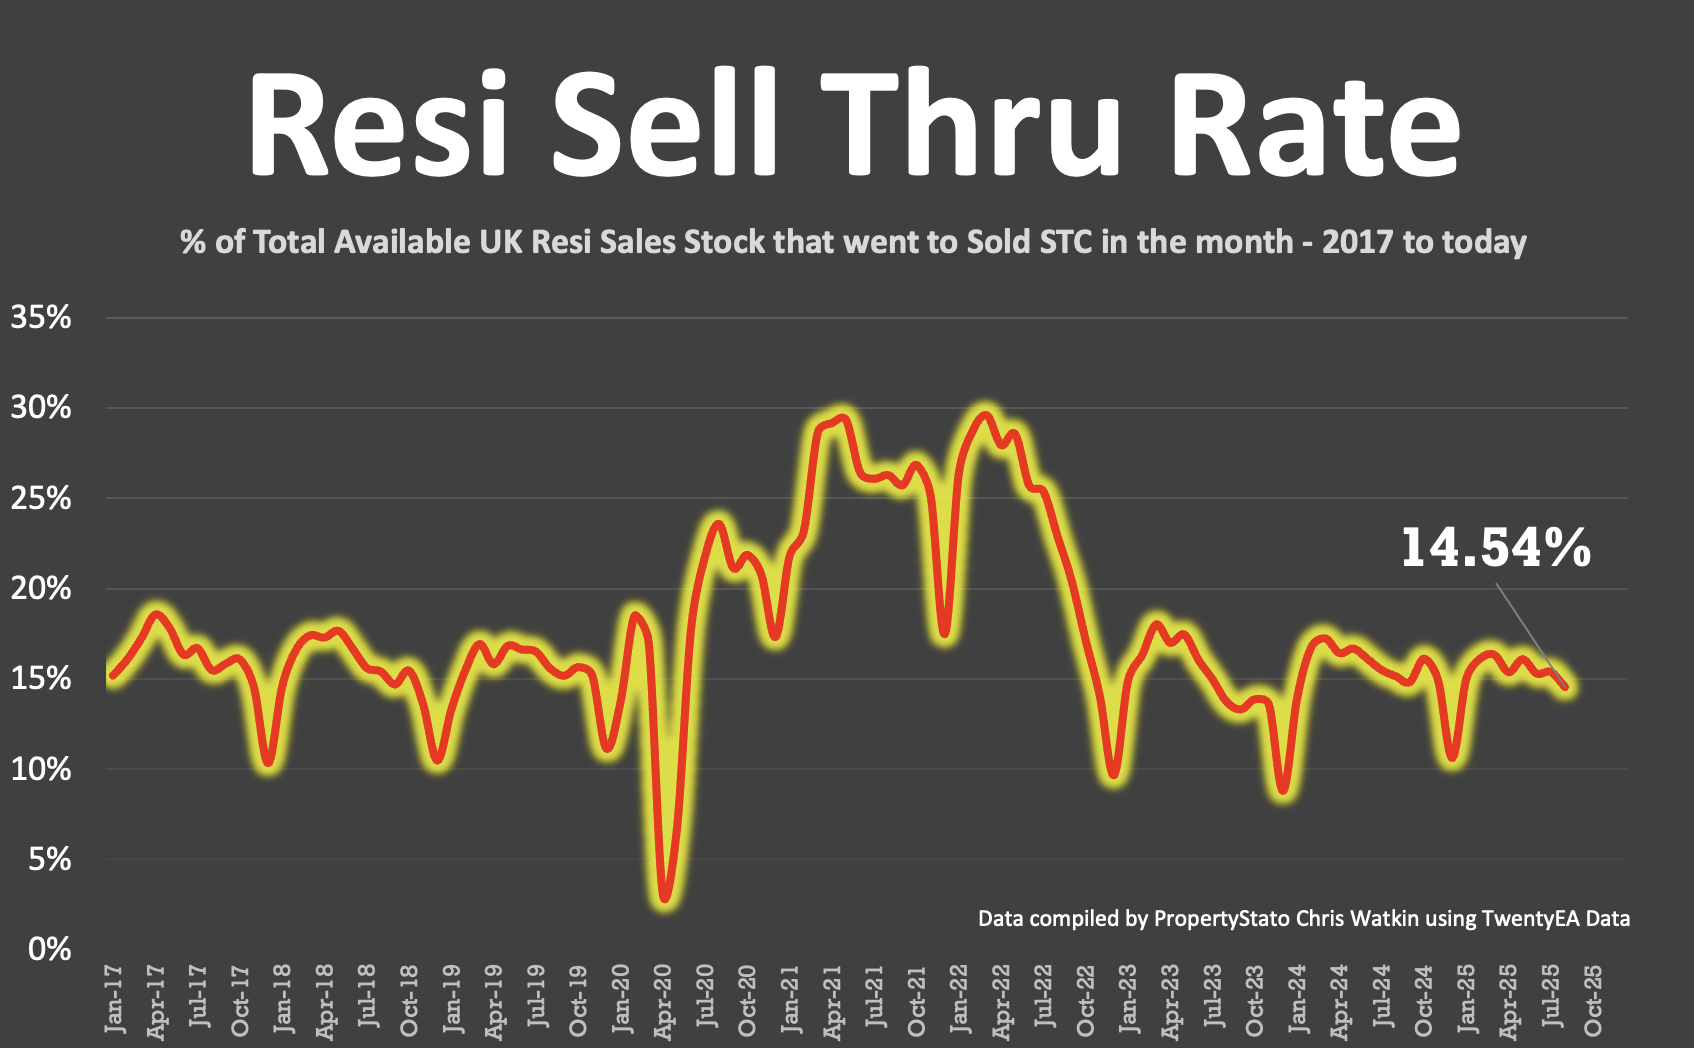
✅ Sell-Through Rate
- 14.5% of homes on agents’ books went SSTC in August.
- Down from 15.4% in July, 15.3% in June, and 16.1% in May.
- Pre-Covid average: 15.5%.
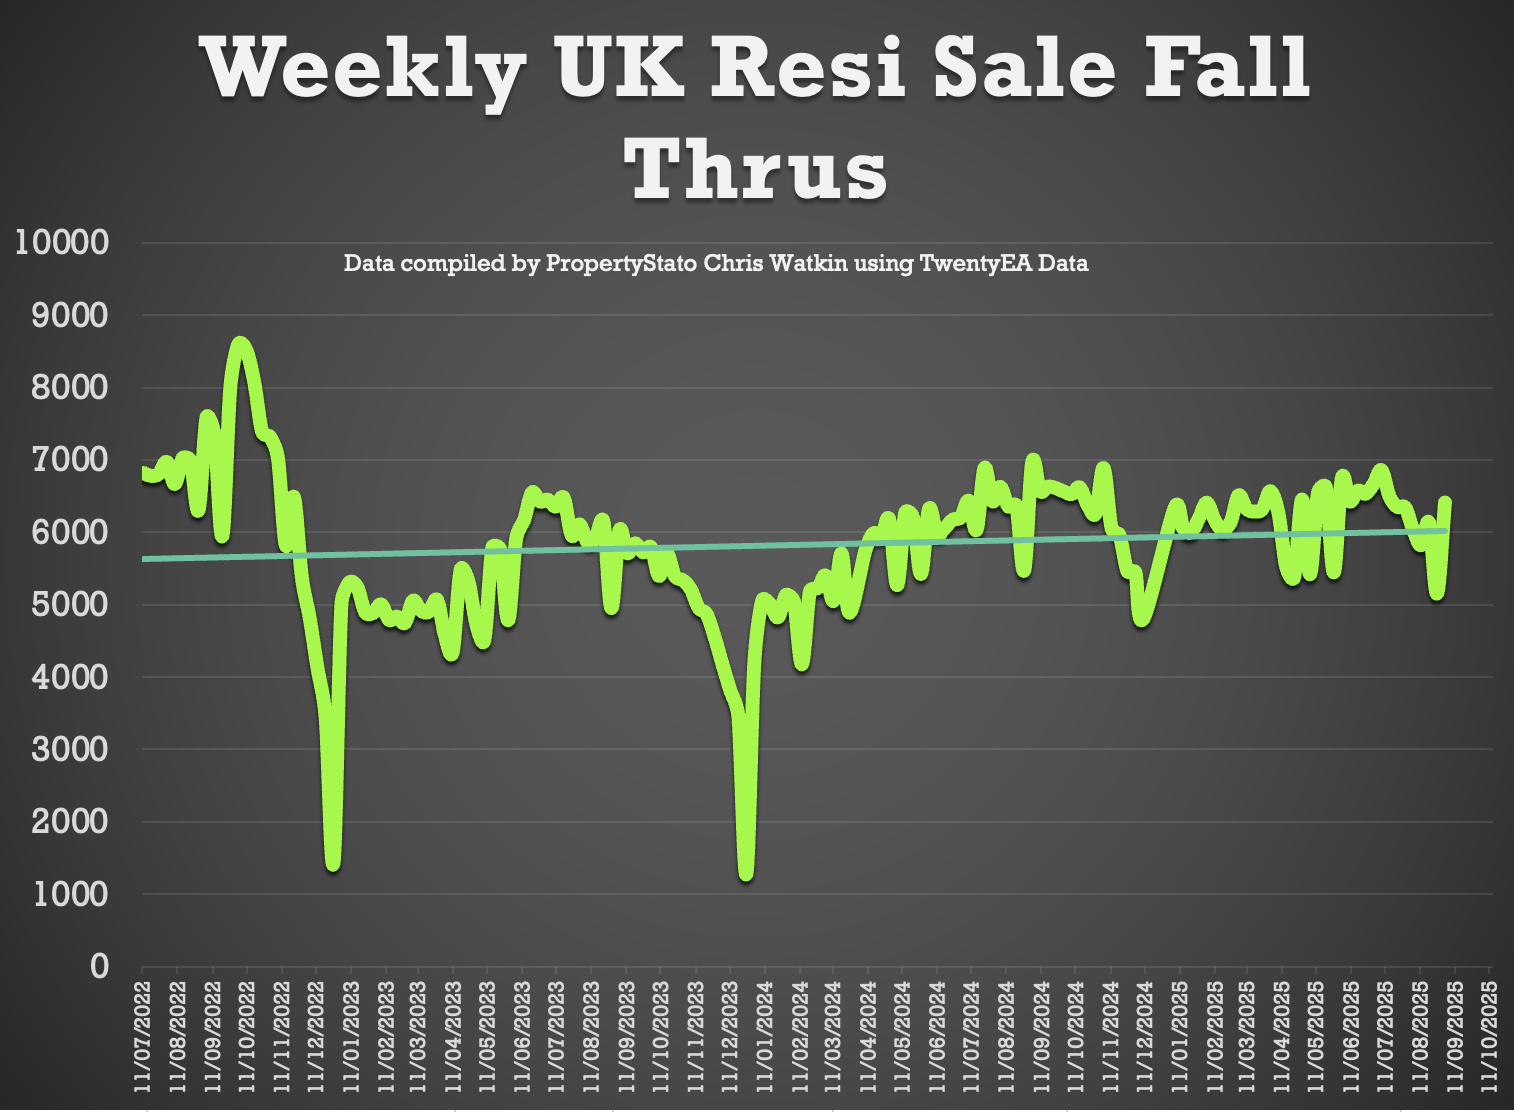
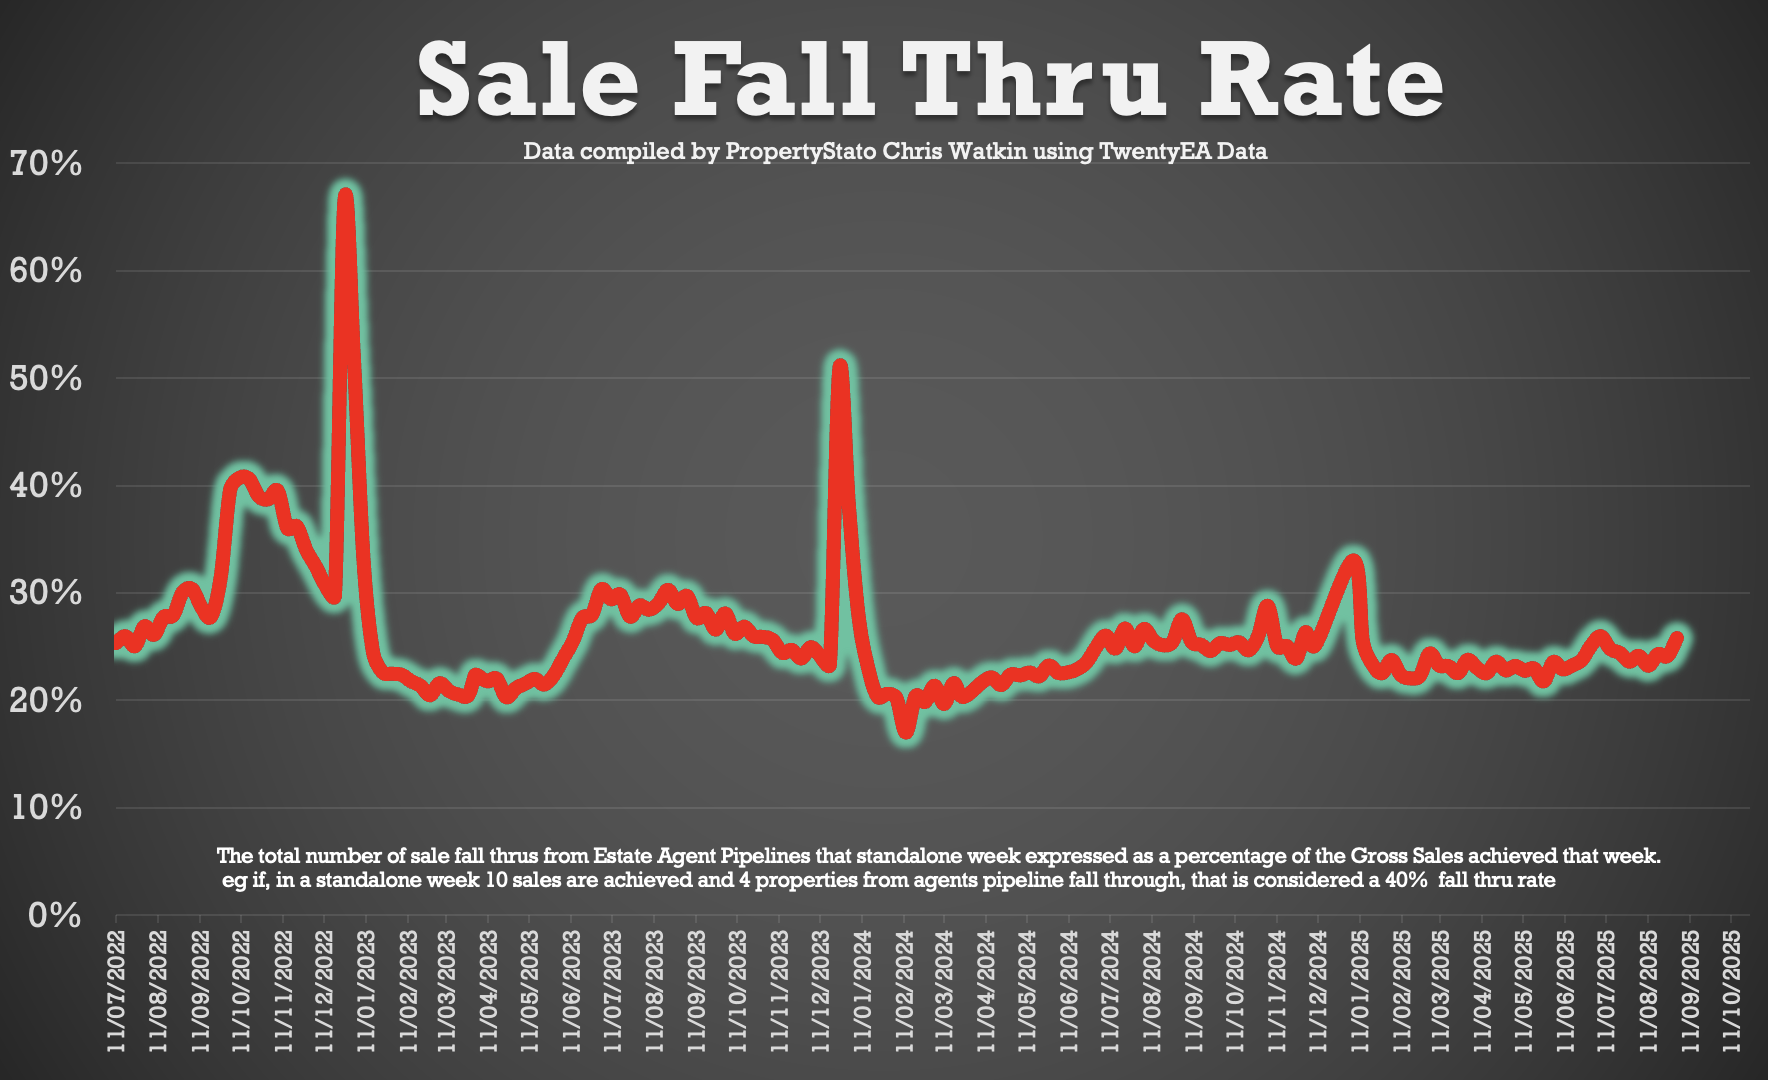
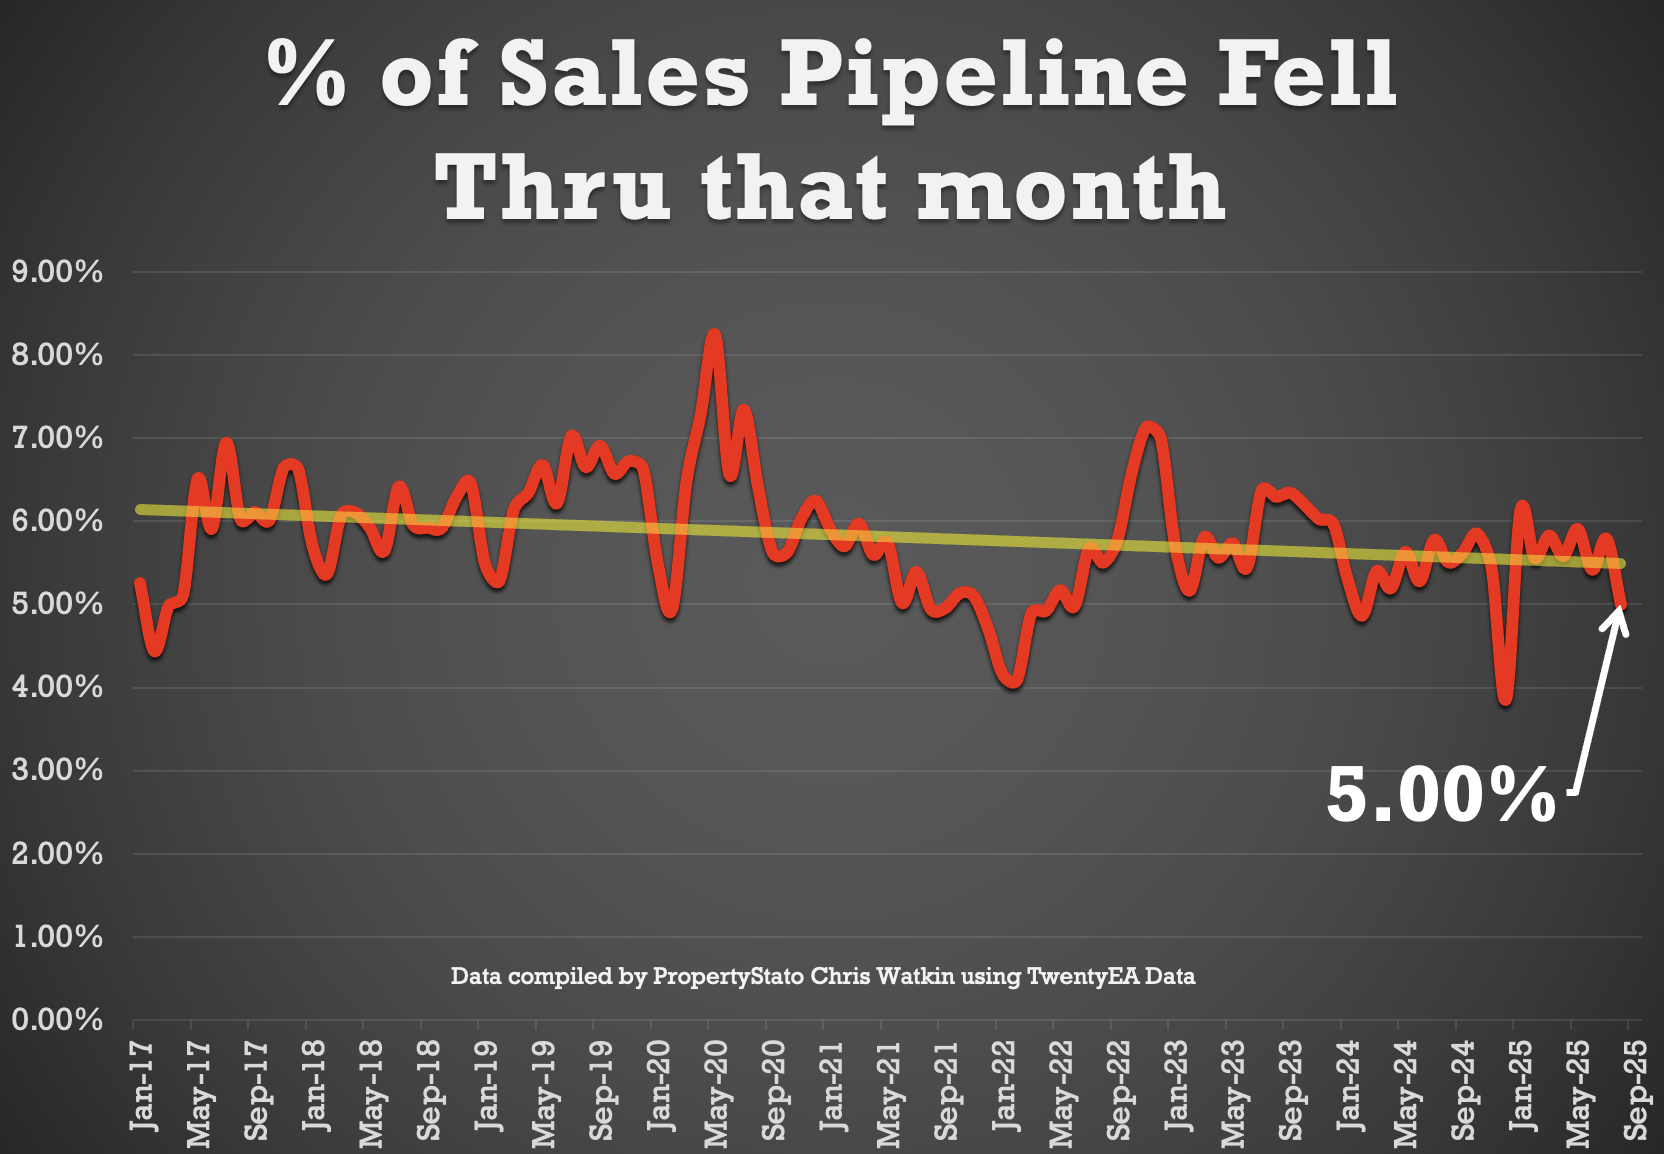
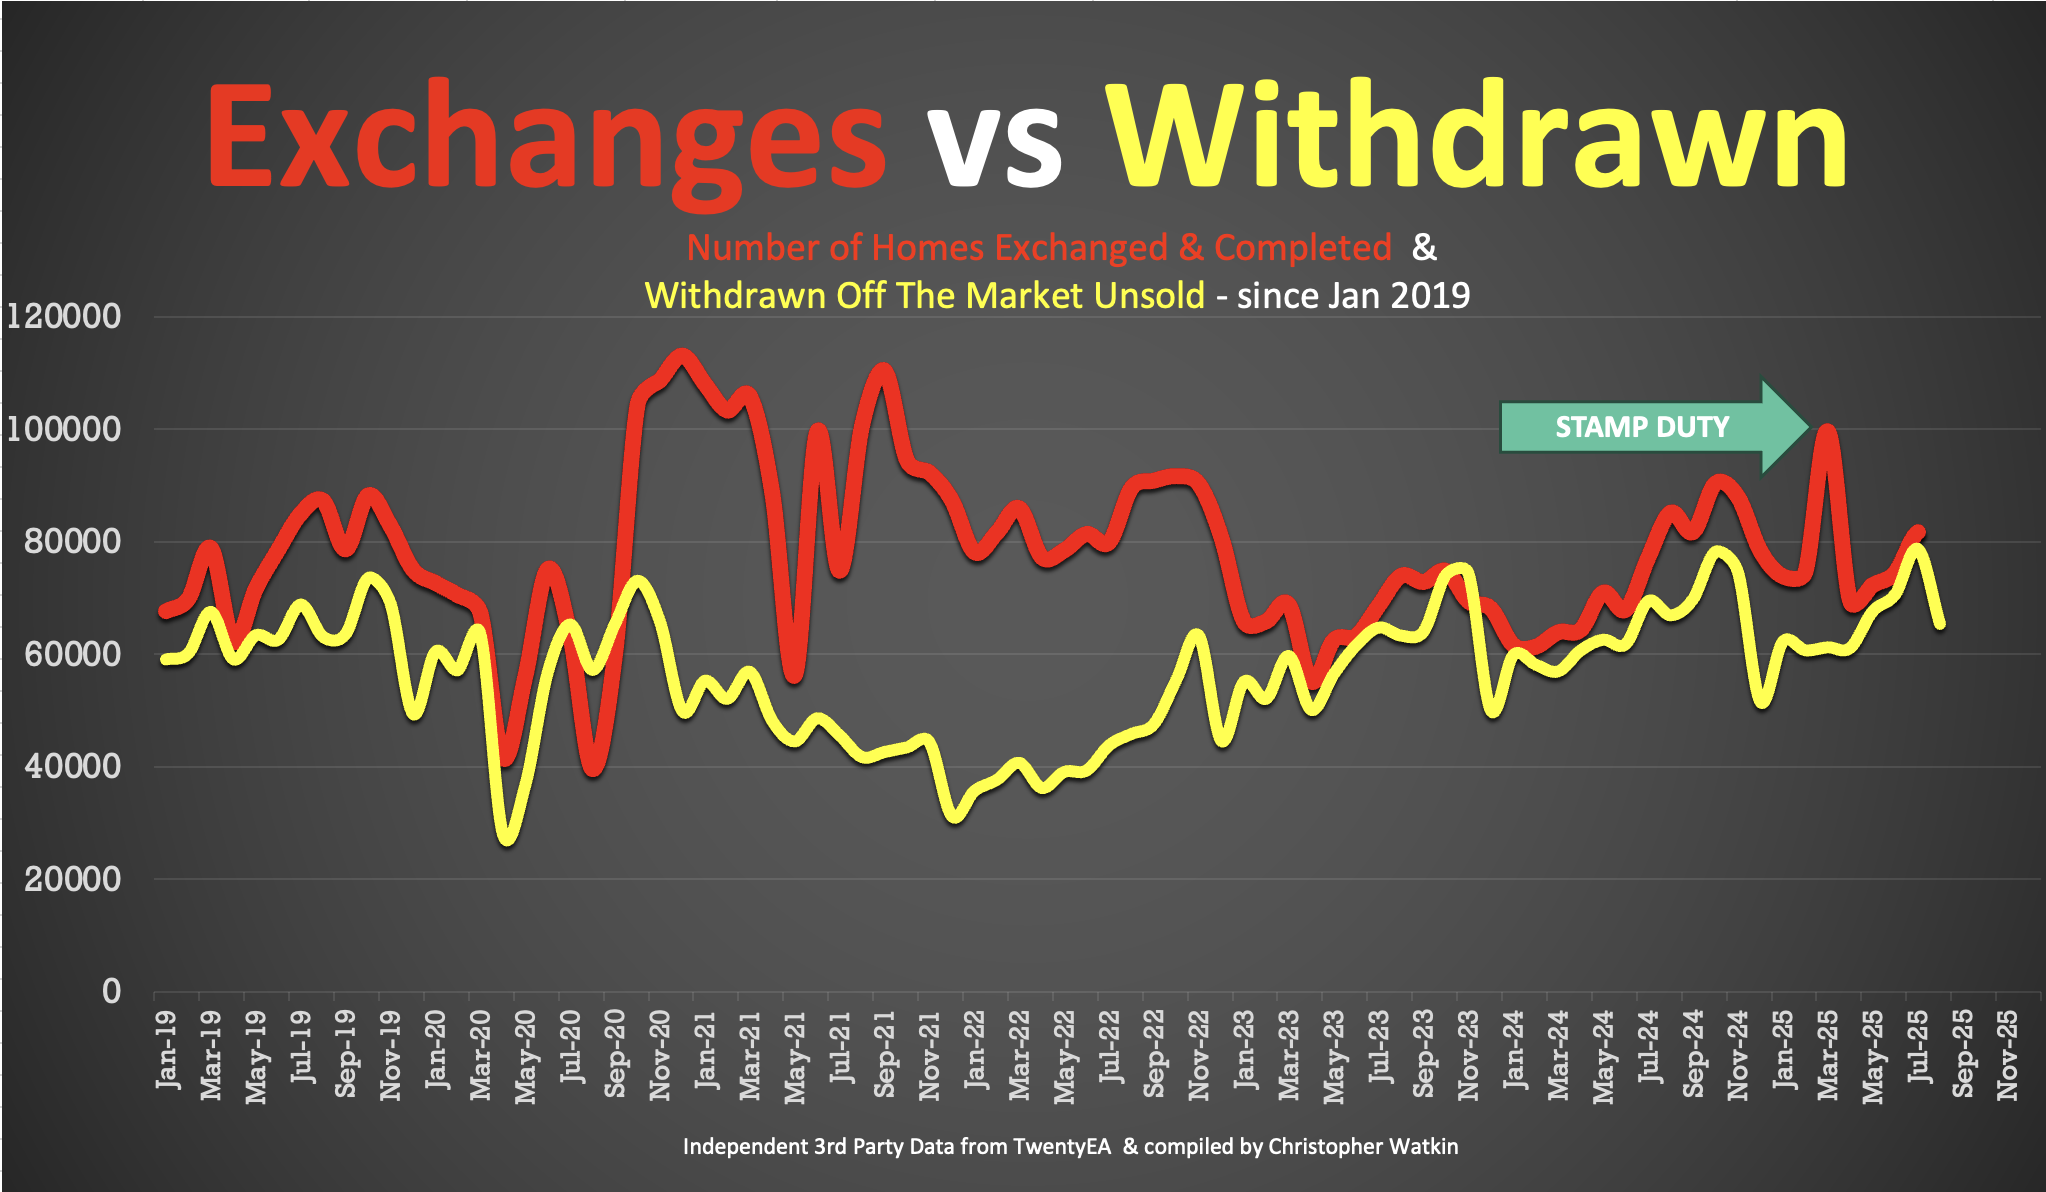
✅ Fall-Throughs
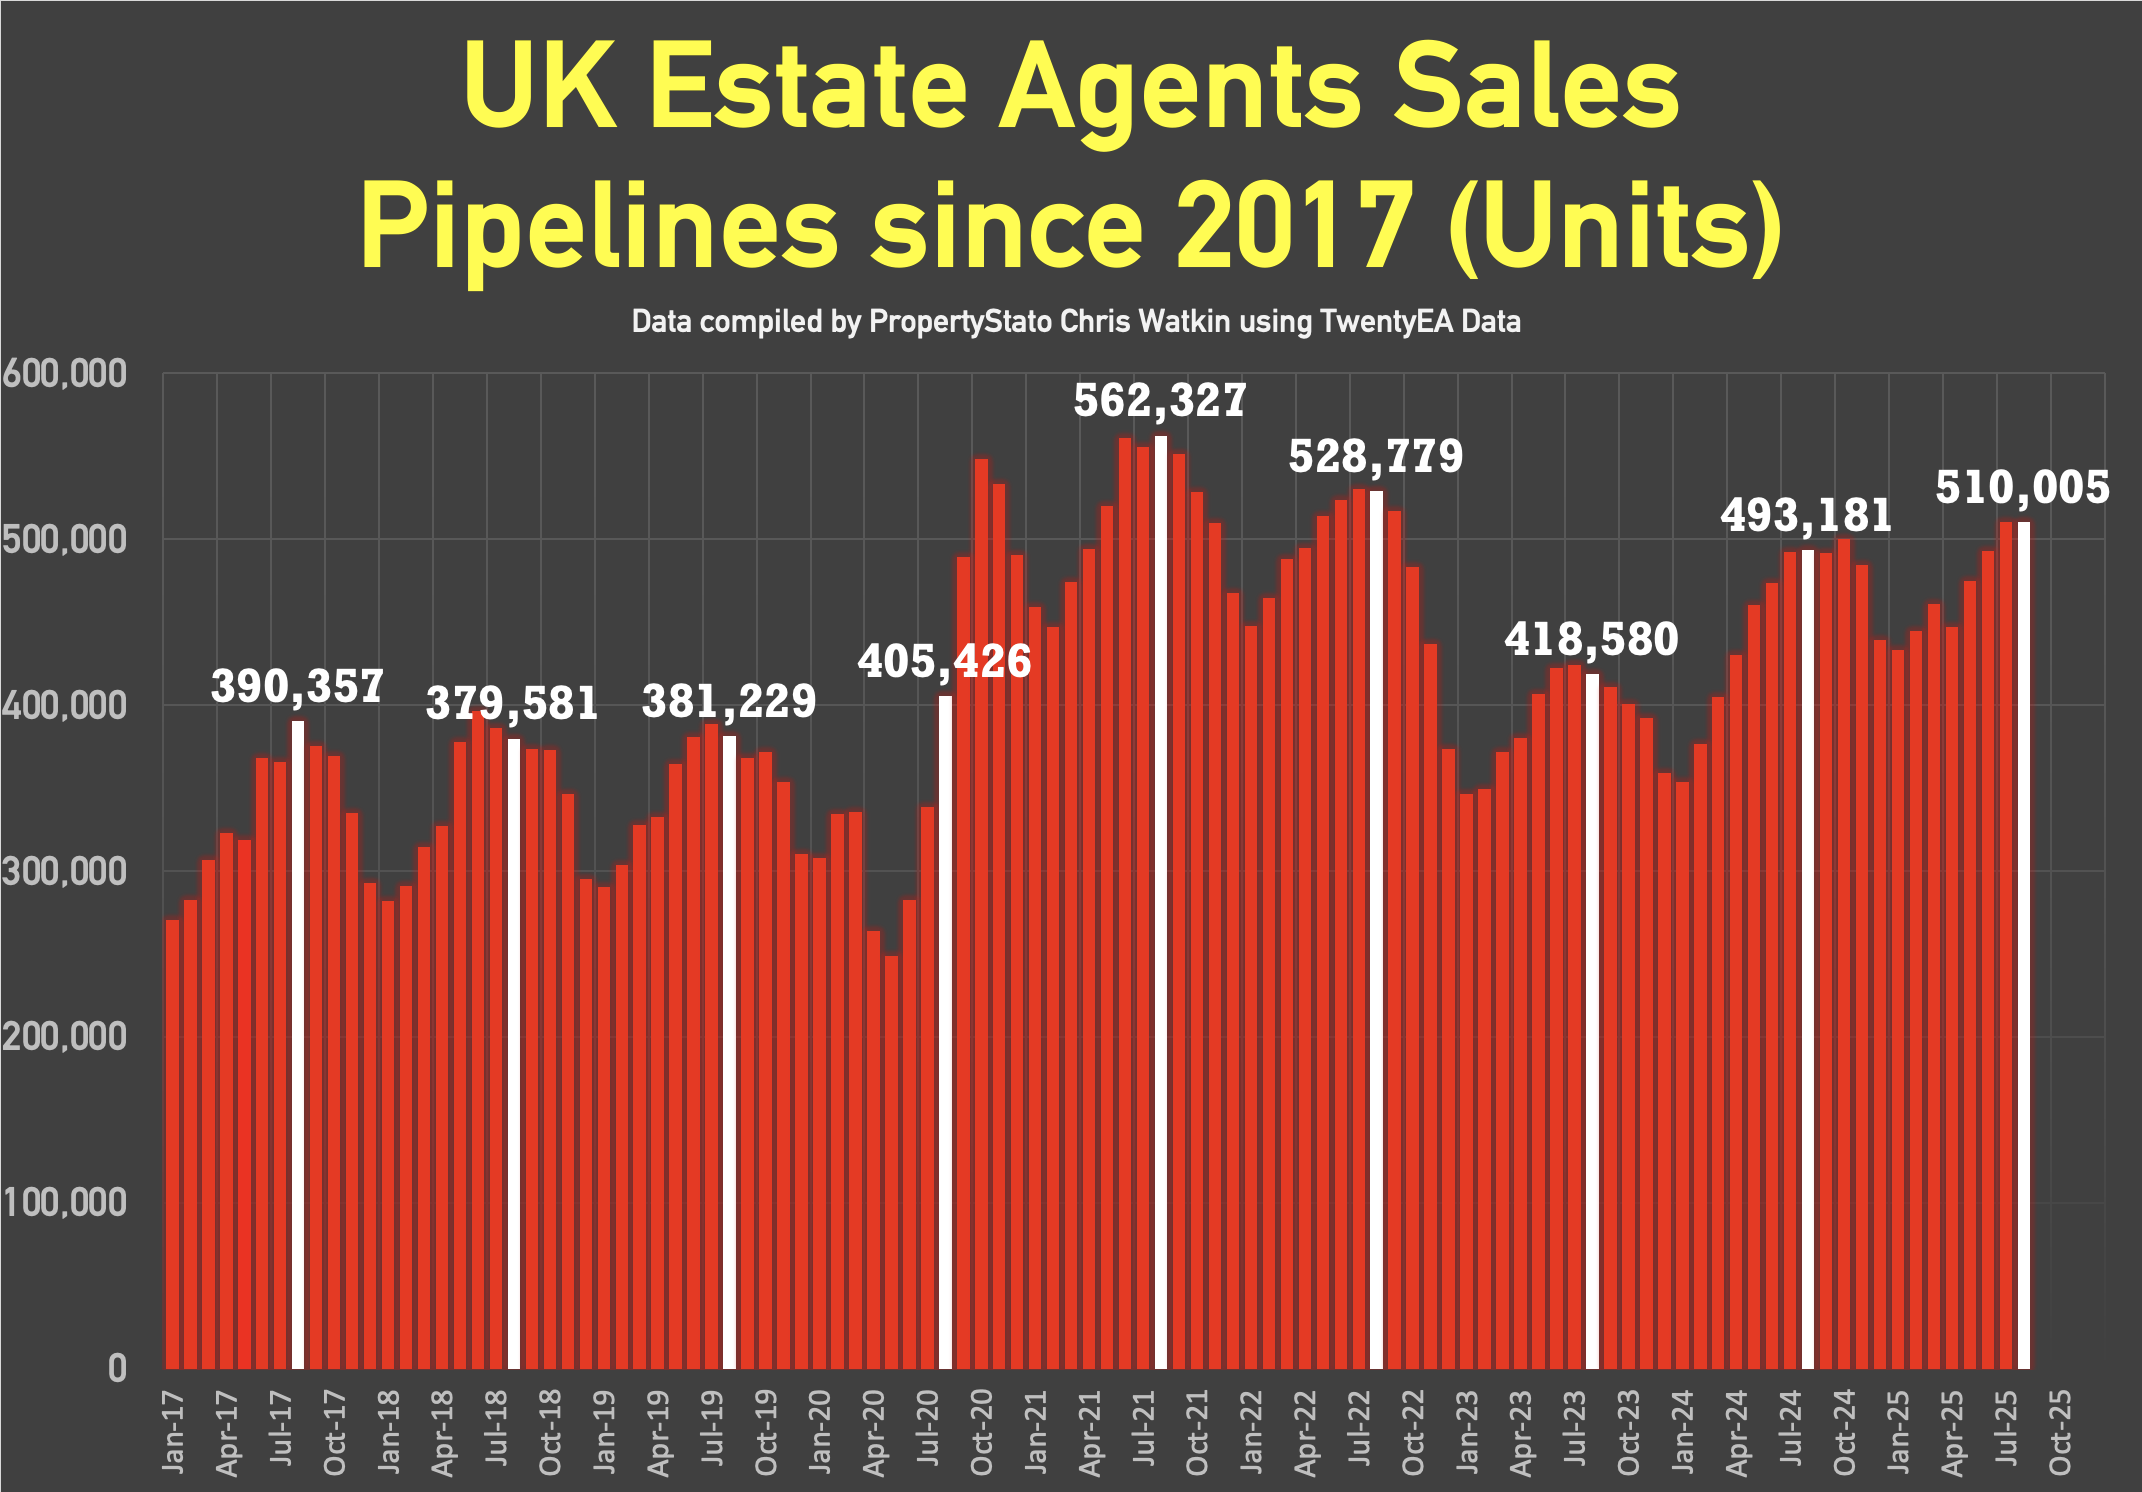
- 6,347 fall-throughs last week (pipeline of 510k home Sold STC).
- Weekly average for 2025: 6,216.
- Fall-through rate: 24.8%, up from 25.8% last week.
- Long-term average: 24.2% (post-Truss chaos saw levels exceed 40%).
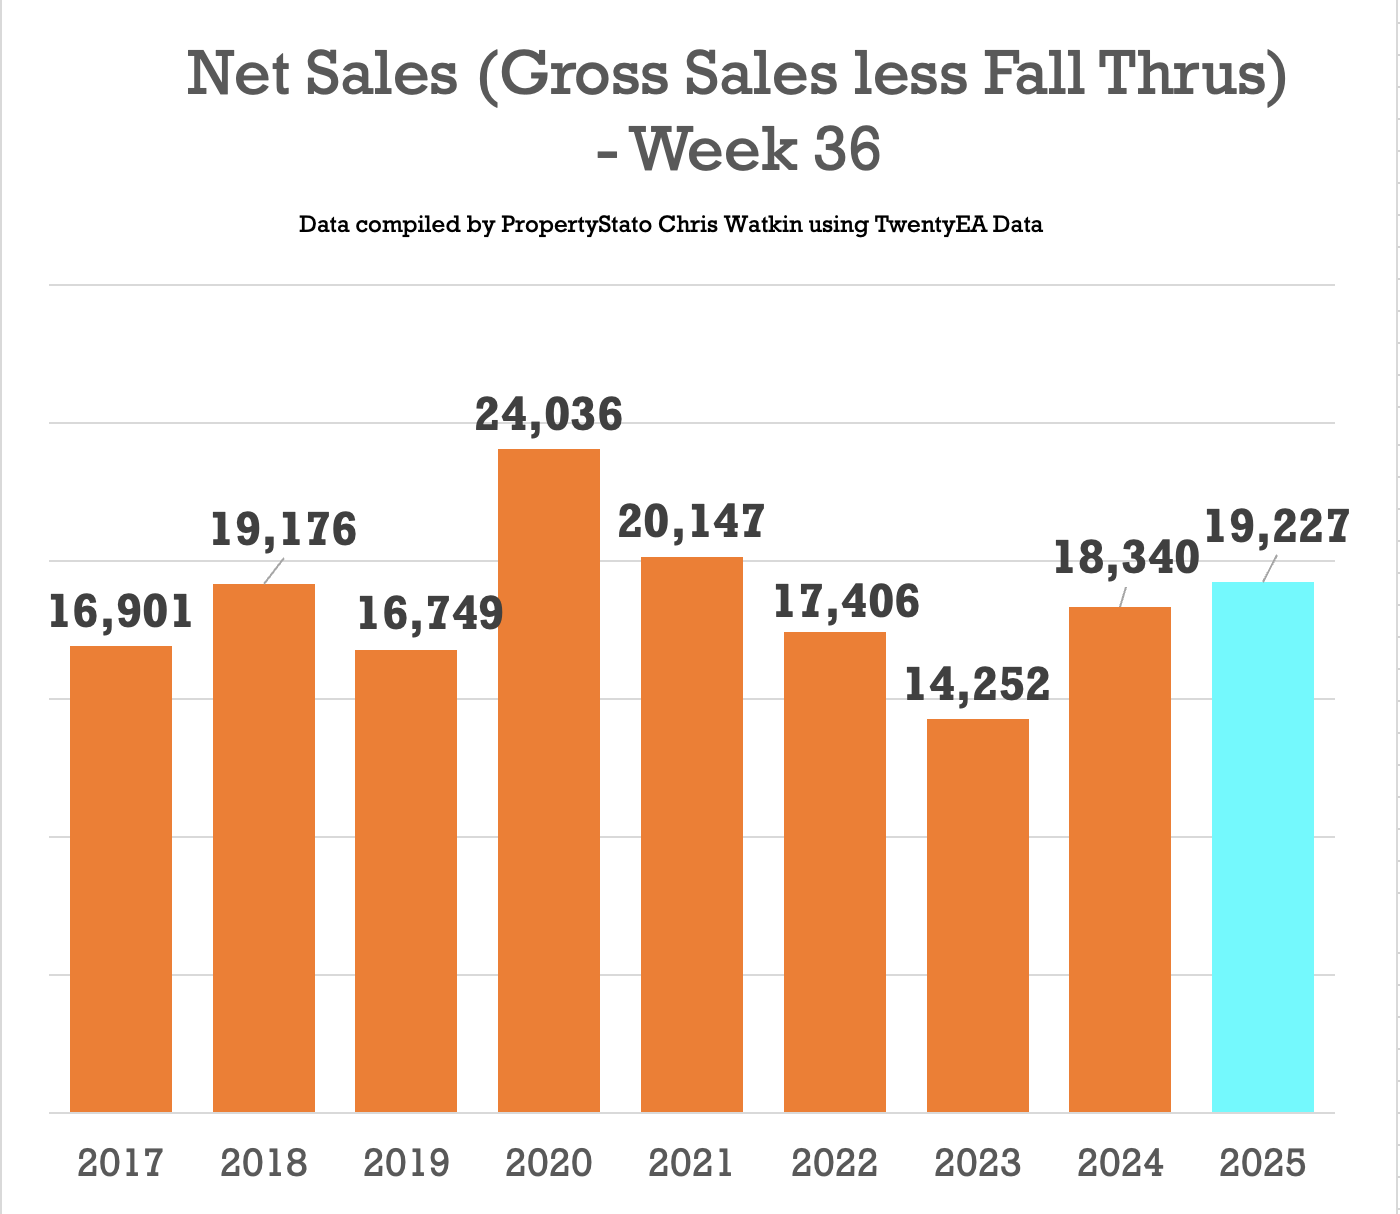
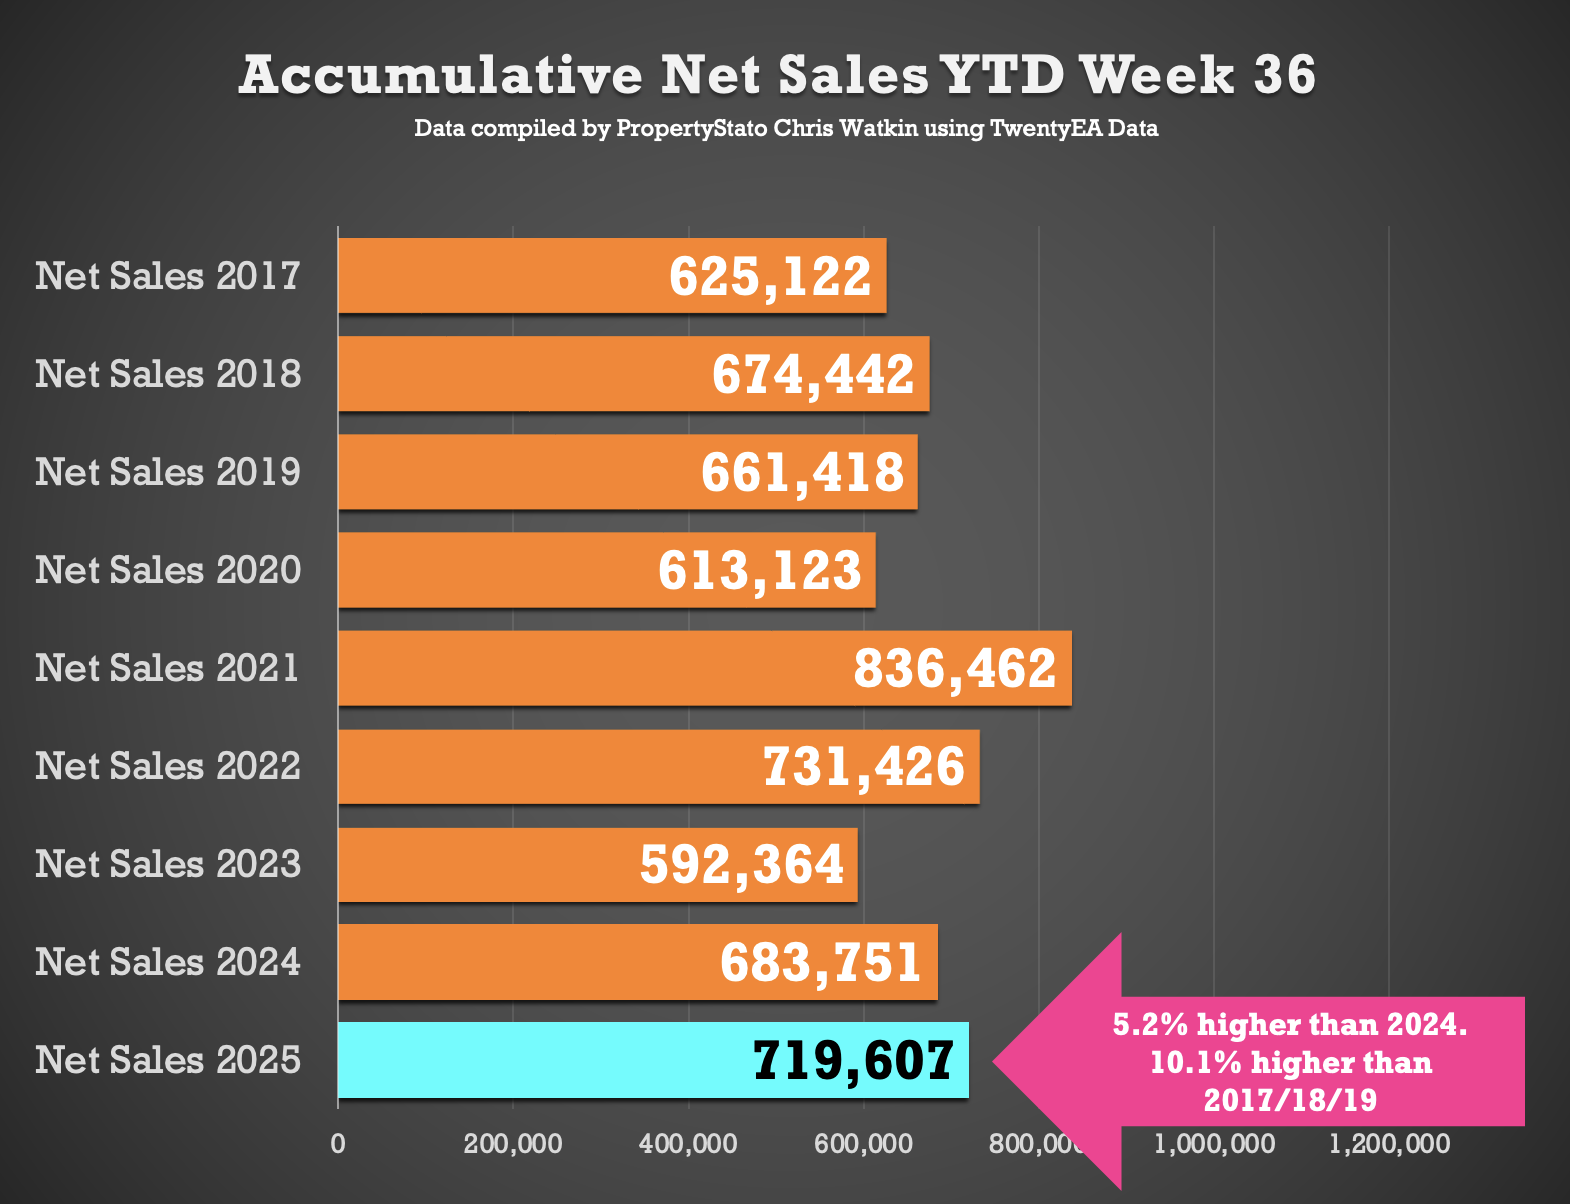
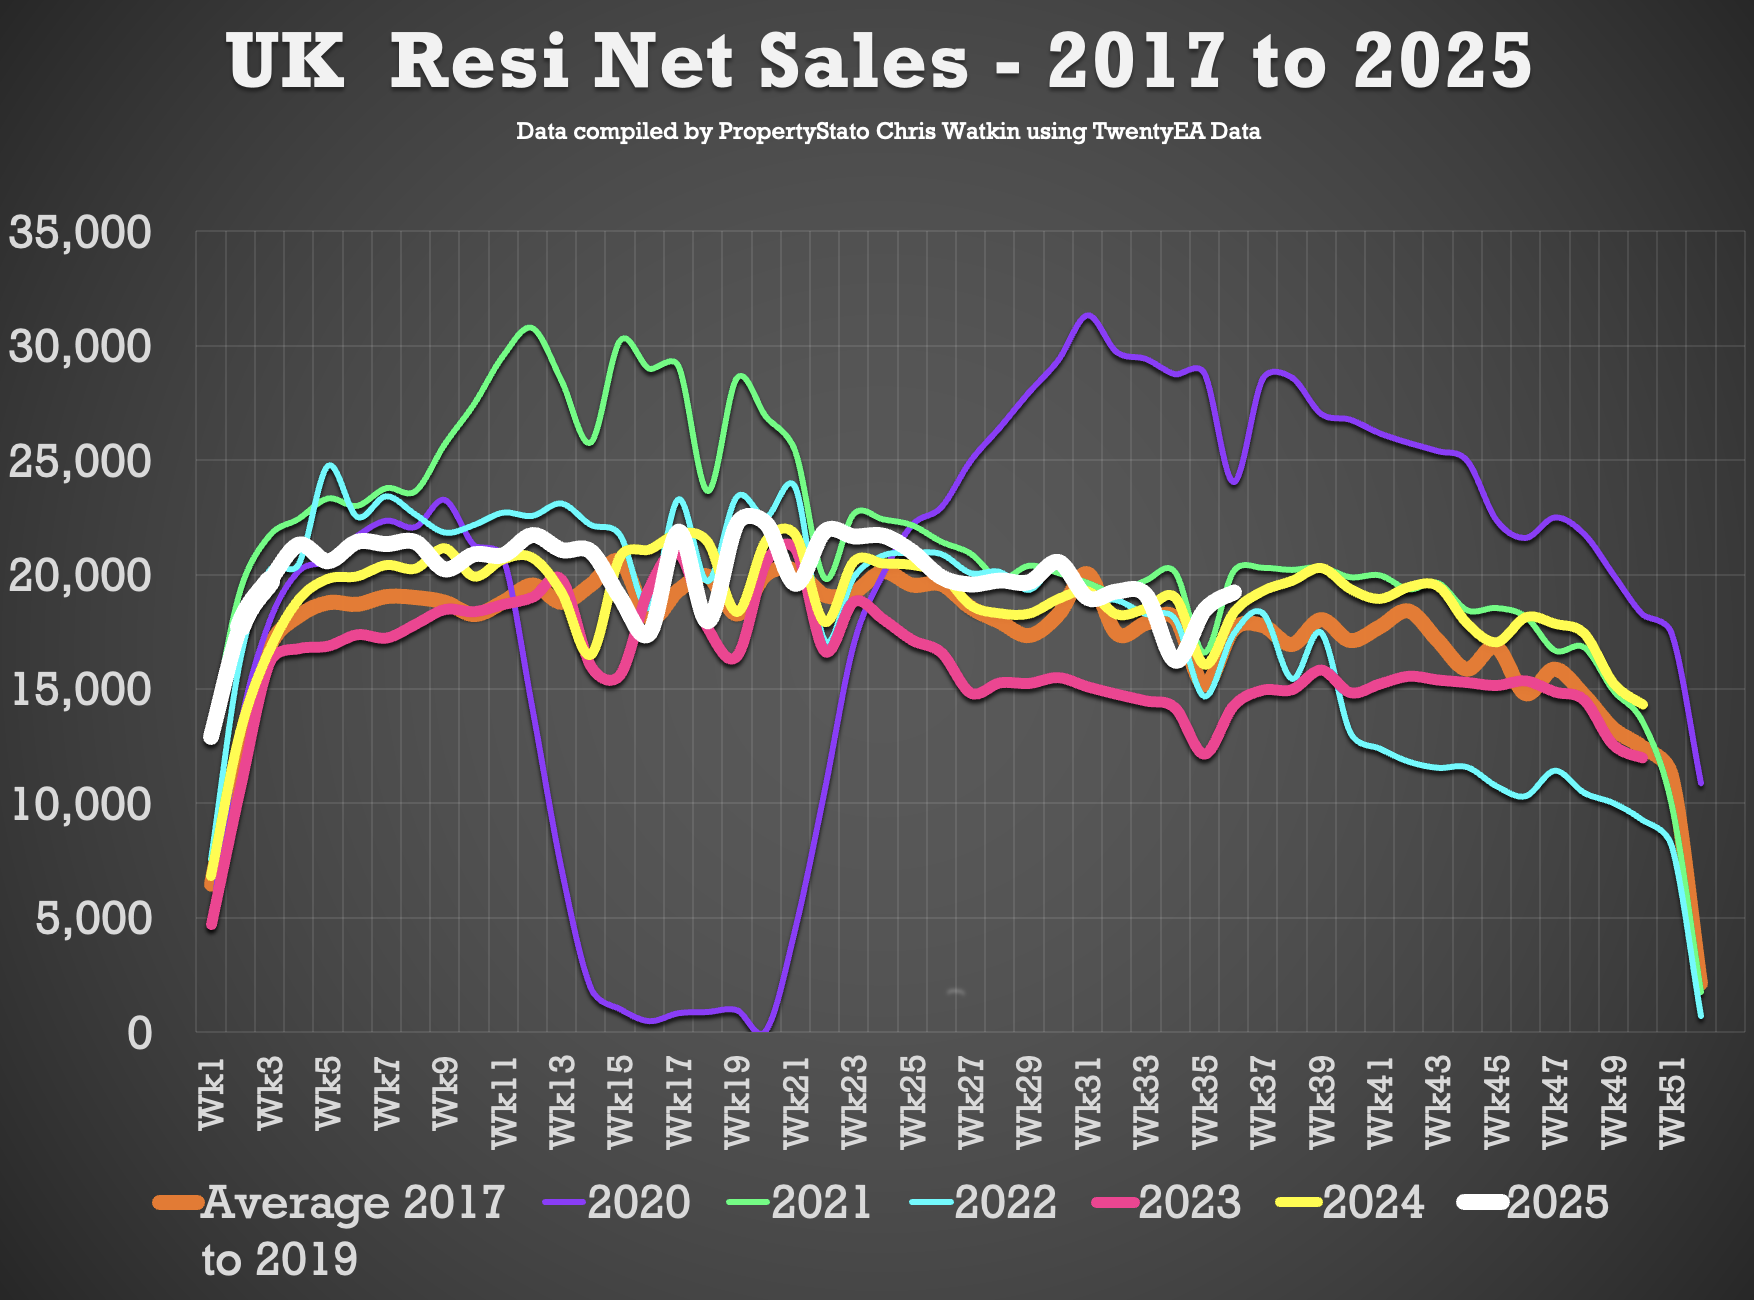
✅ Net Sales
- 19.2k net sales this week, up from 18.5k last week.
- Nine-year Week 36 average: 18.5k.
- Weekly average for 2025: 20k.
- YTD: 720k, which is 5.2% ahead of 2024 (684k) and 10.1% above 2017–19 (654k).
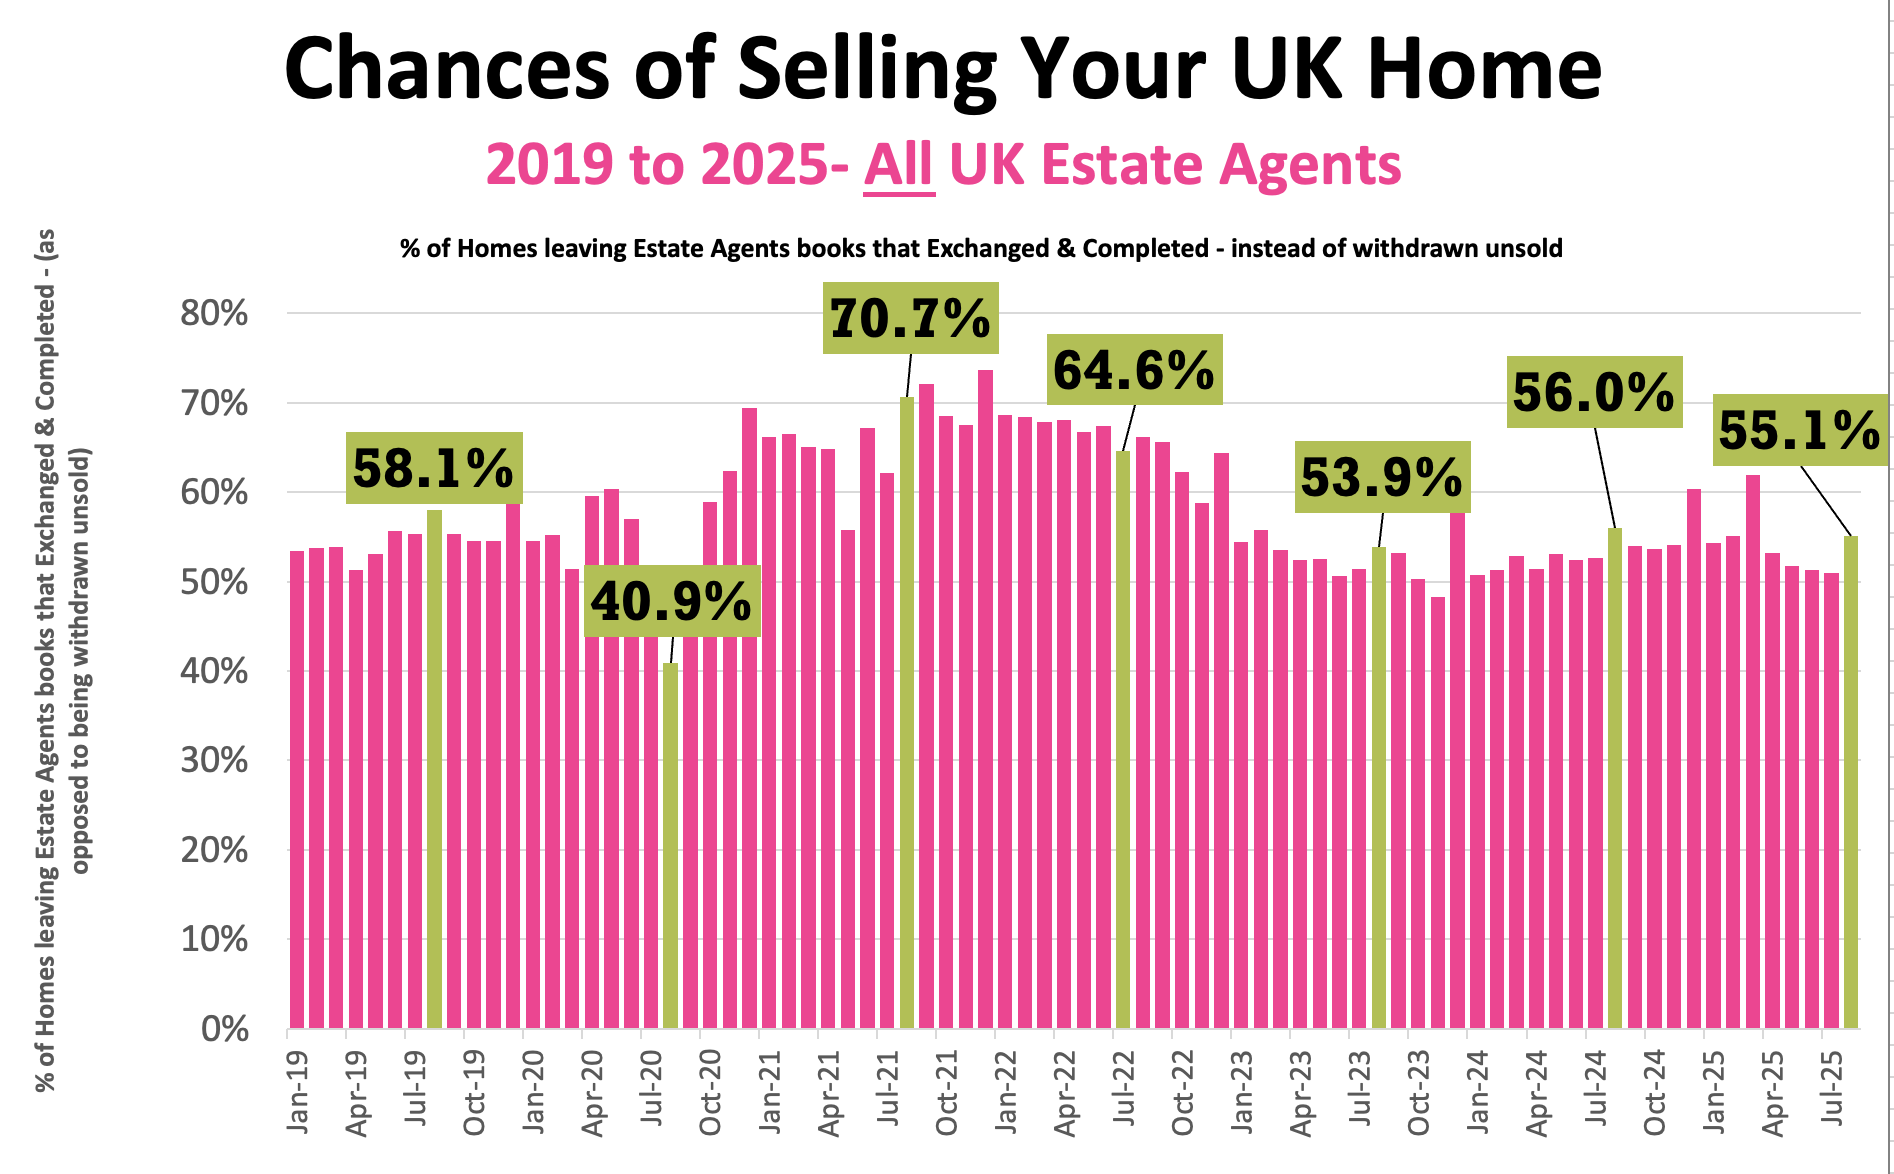
✅ Probability of Selling (% that Exchange vs withdrawal)
- Preliminary August: 55.1% of homes that left agents’ books exchanged & completed.
- July: 50.9% / June: 51.3% / May: 51.7% / April: 53.2%.
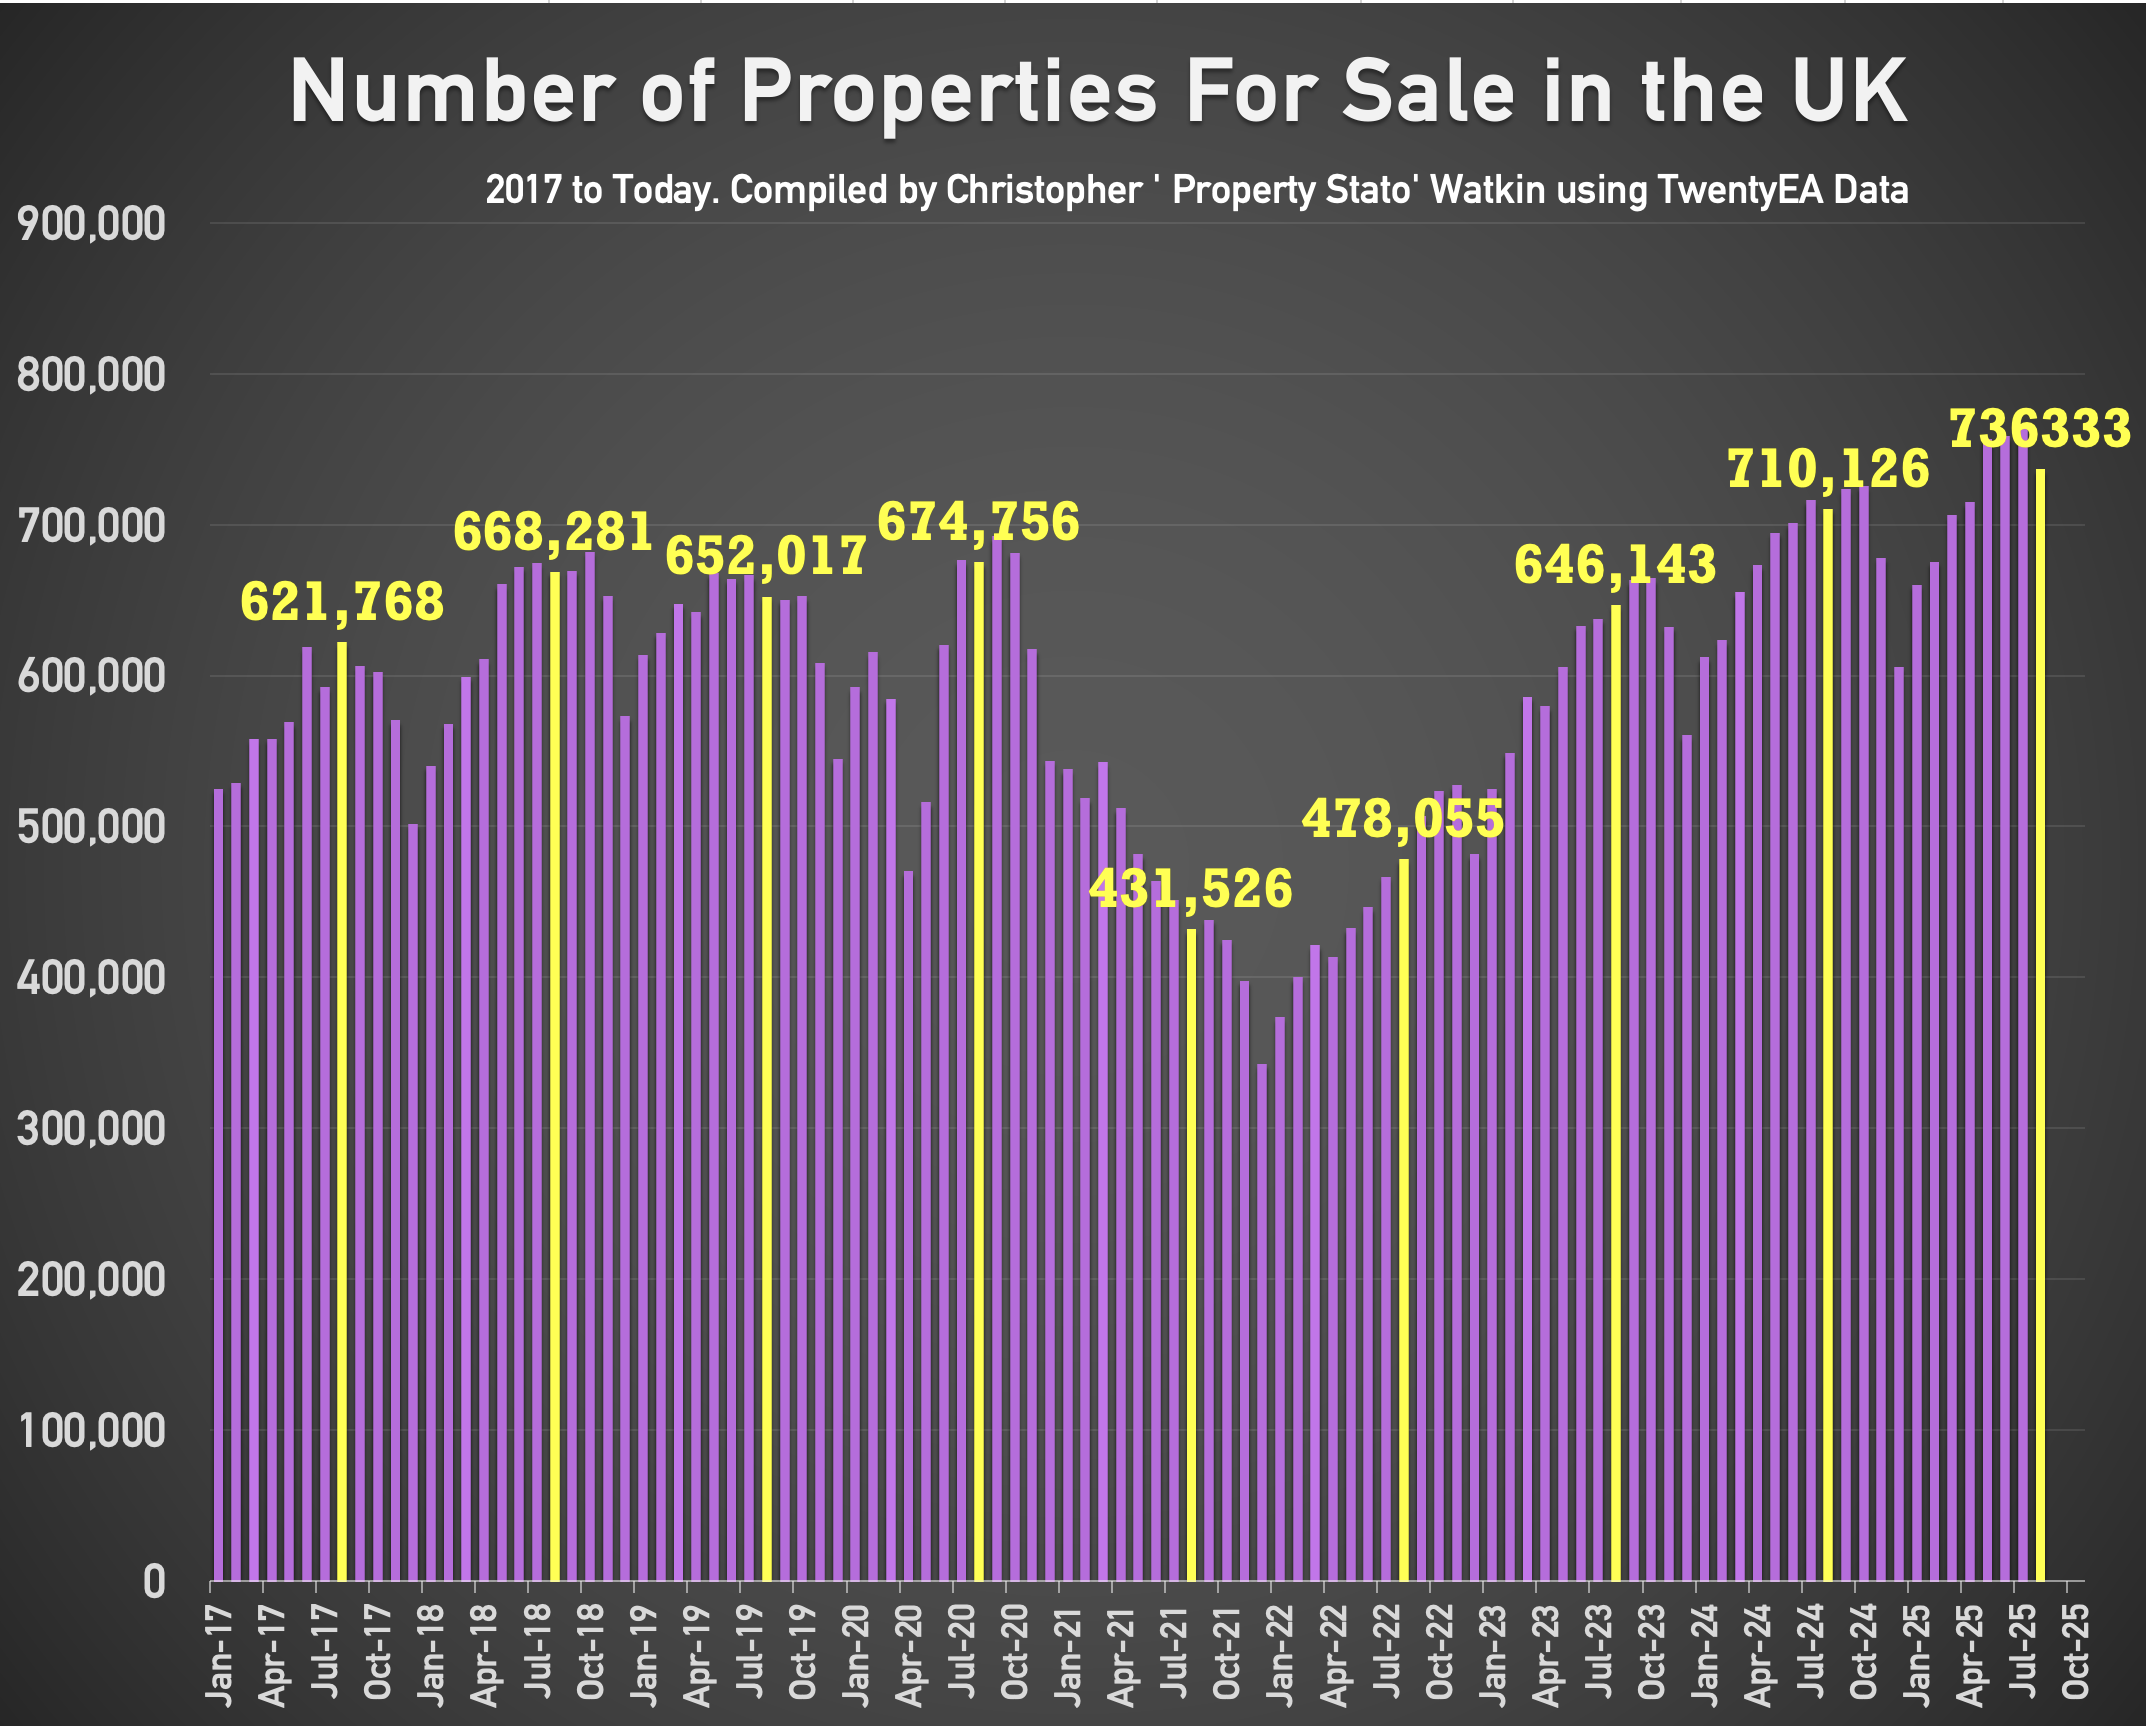
✅ Stock Levels (1st of Month)
- 736k homes on the market at the start of September, 6.7% higher than Sept 2024.
- 510k homes in pipelines, 3.4% higher than August 2024.
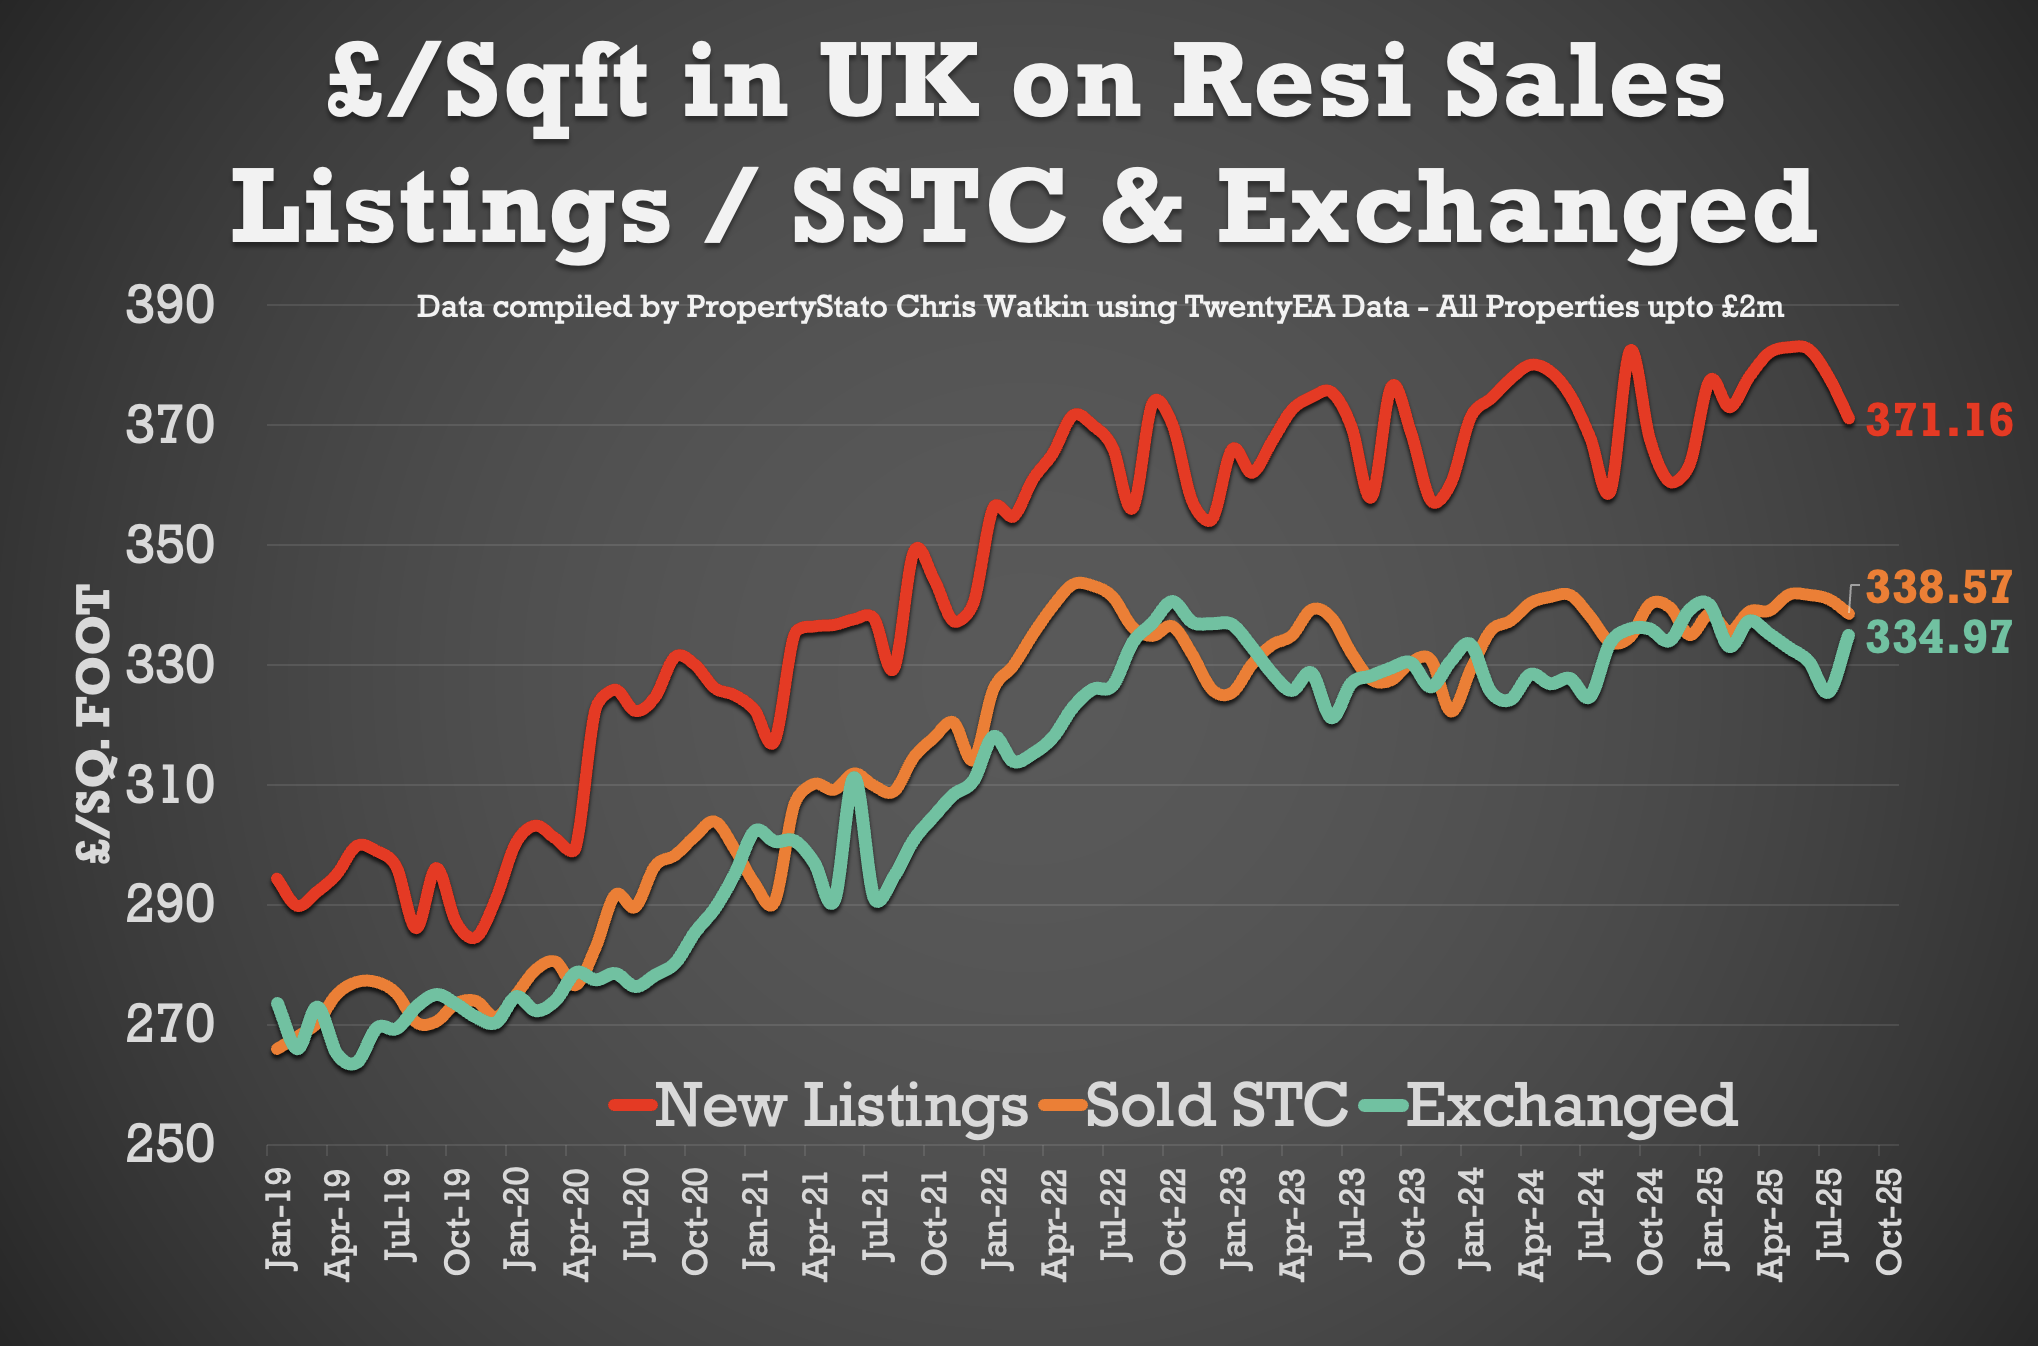
✅ House Prices (£/sq.ft)
- August 2025 agreed sales averaged £338.78 per sq.ft.
- 1.41% higher than August 2024, and 14.25% higher than August 2020.
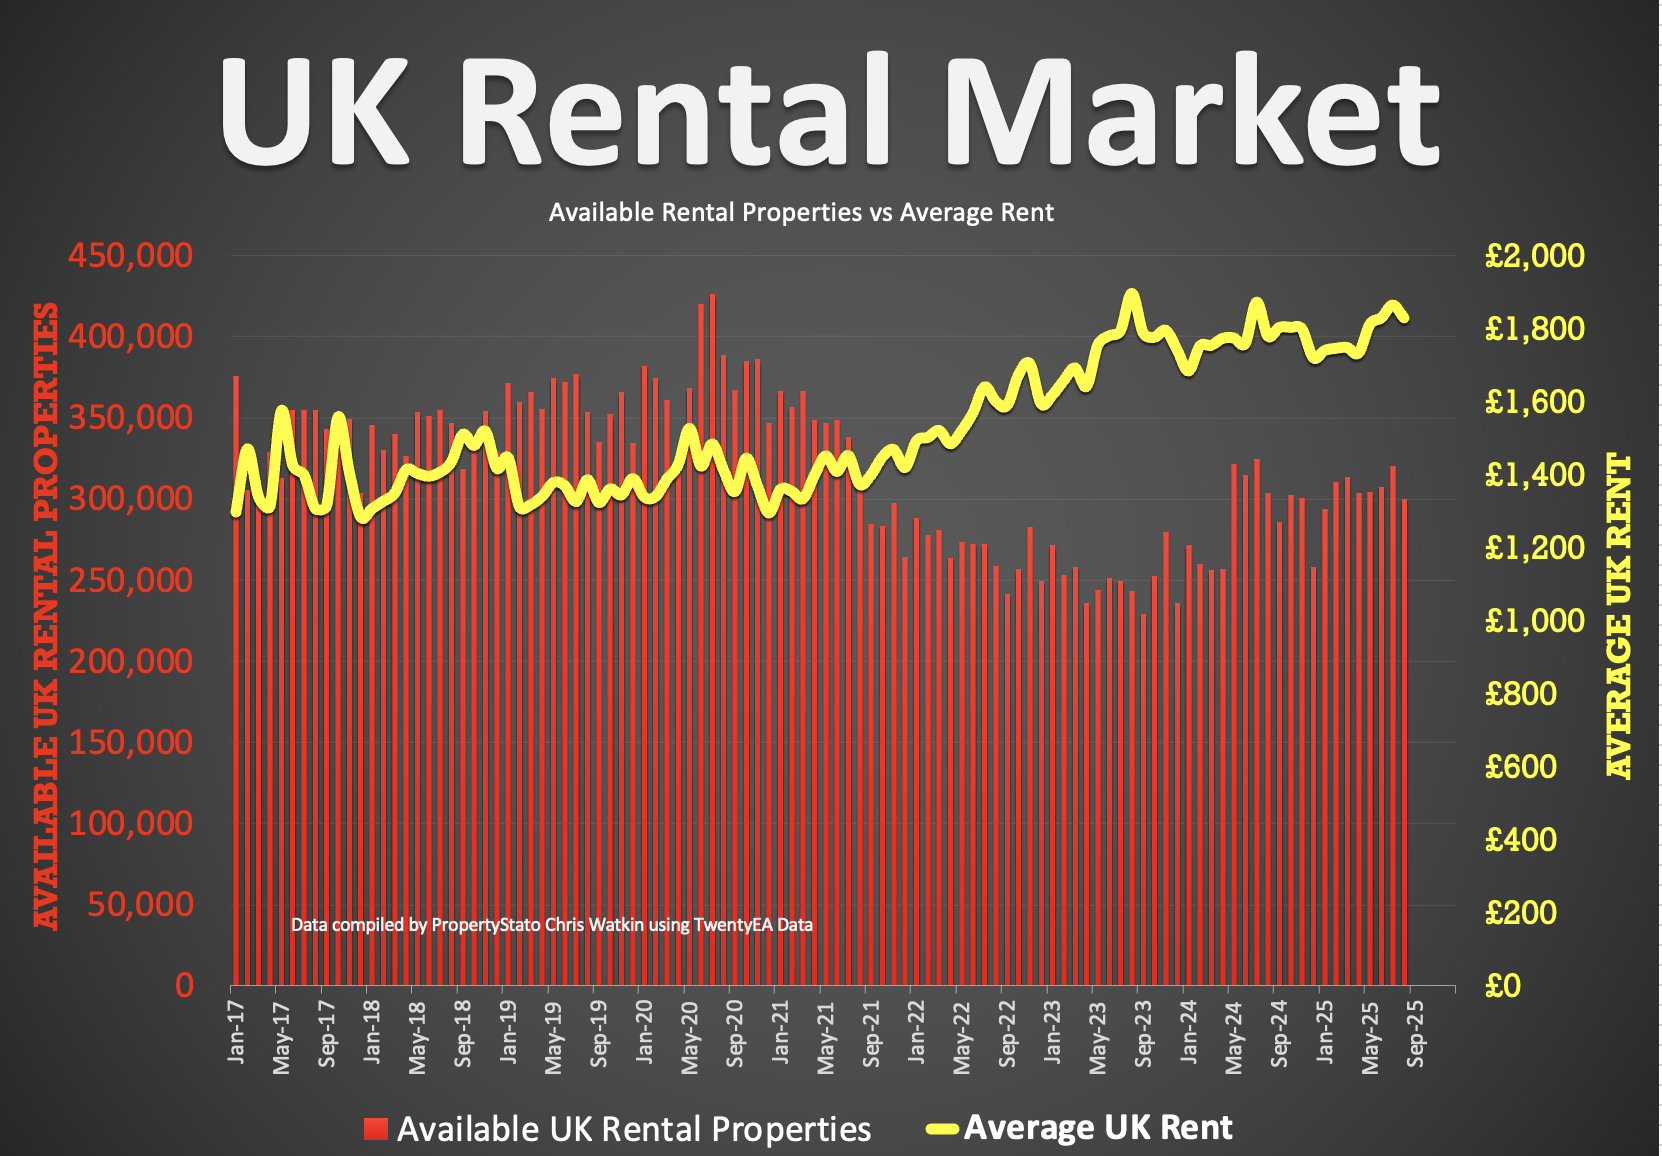
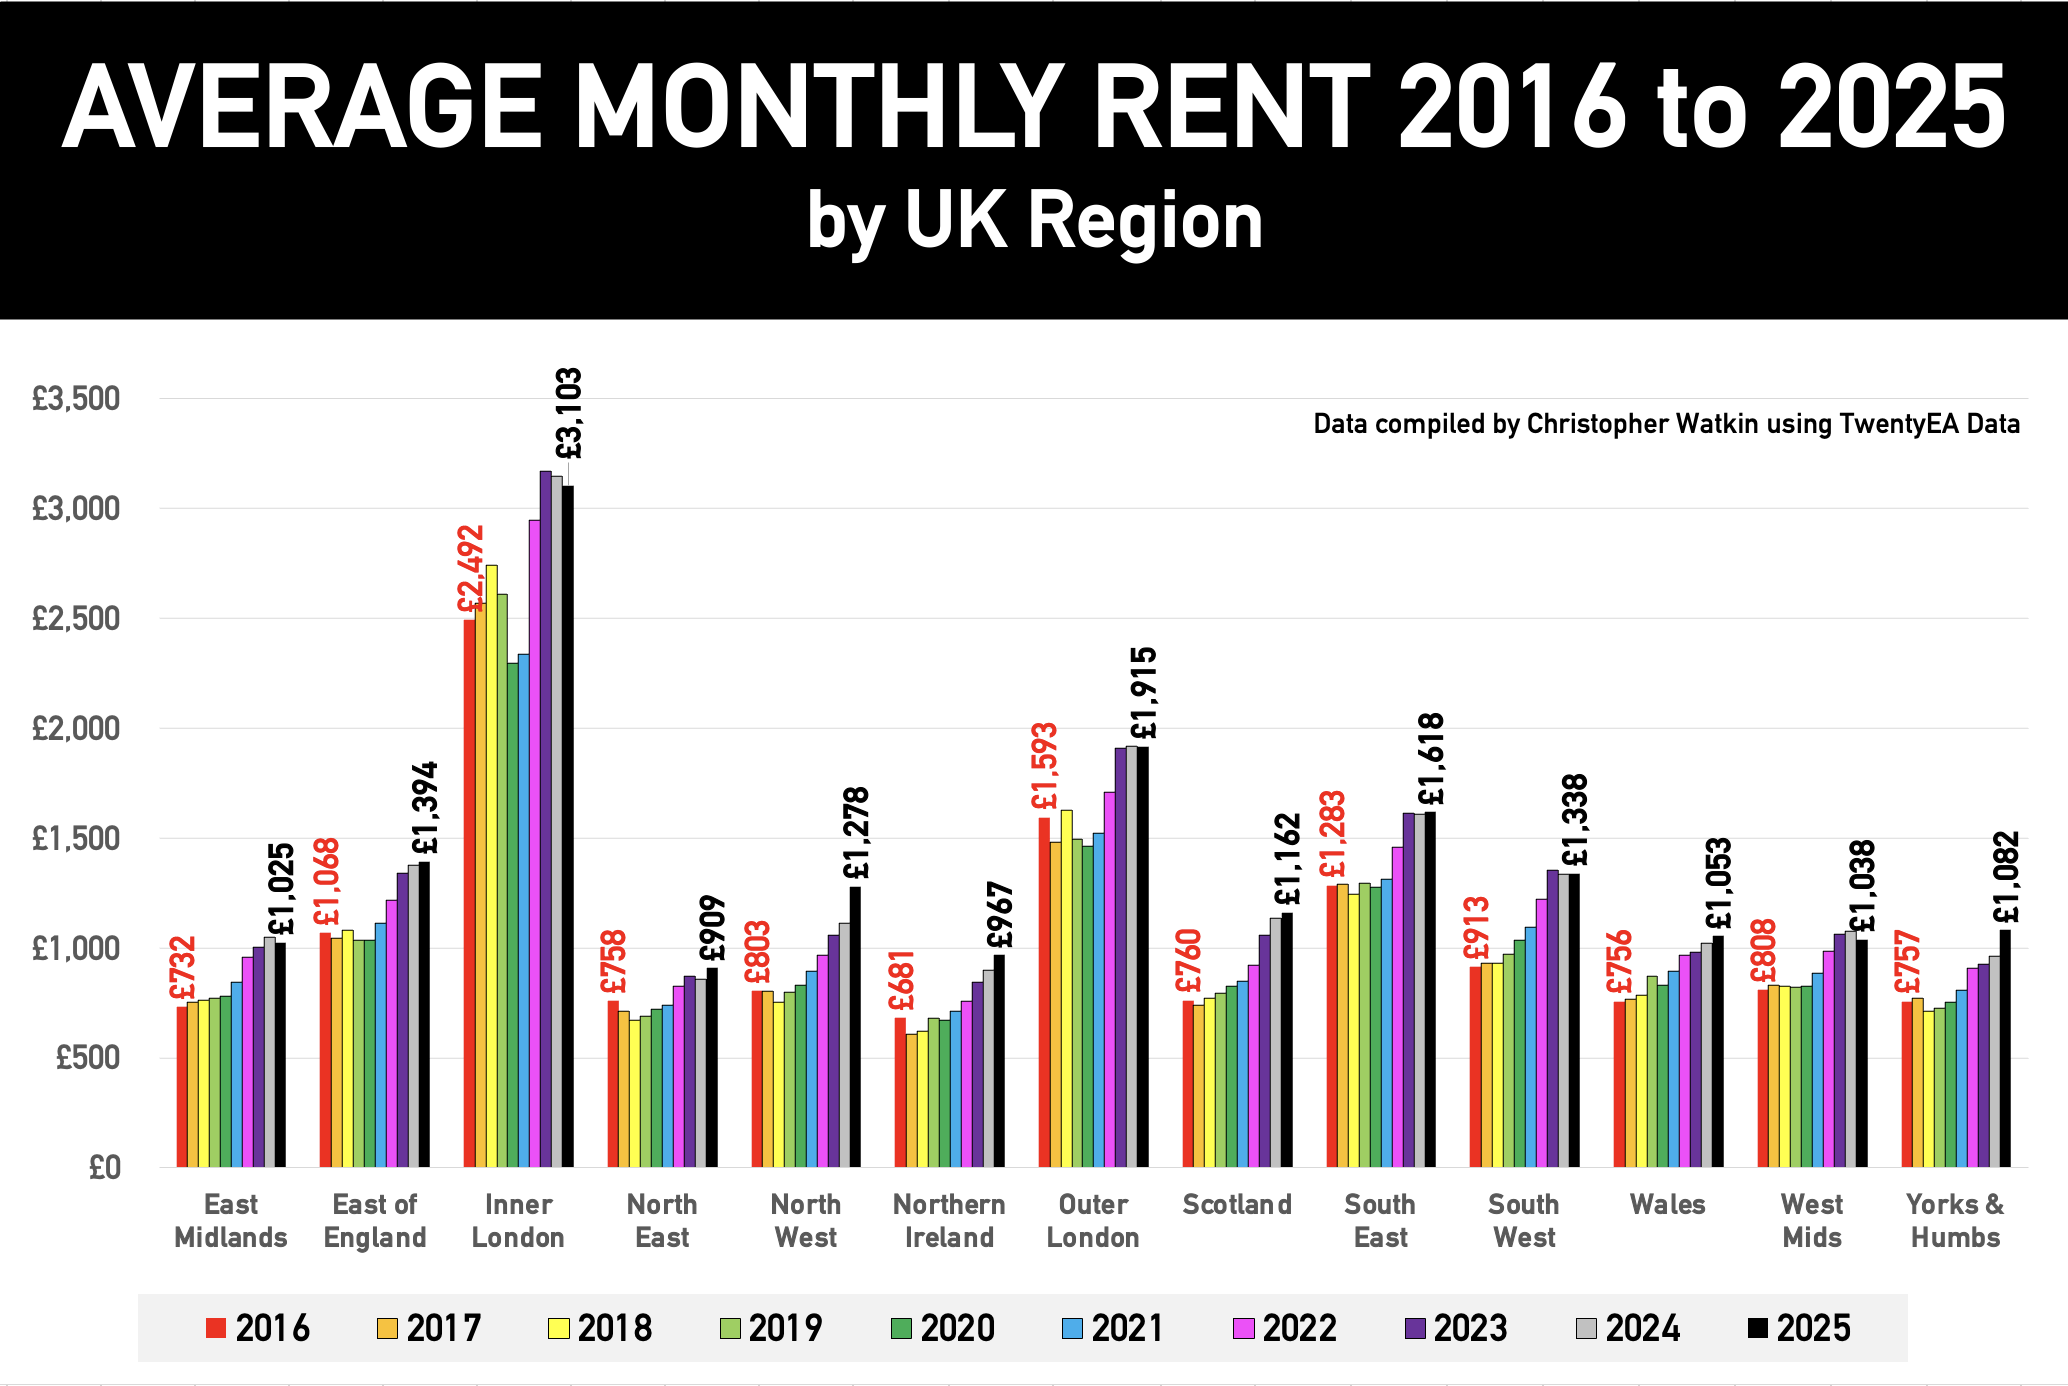
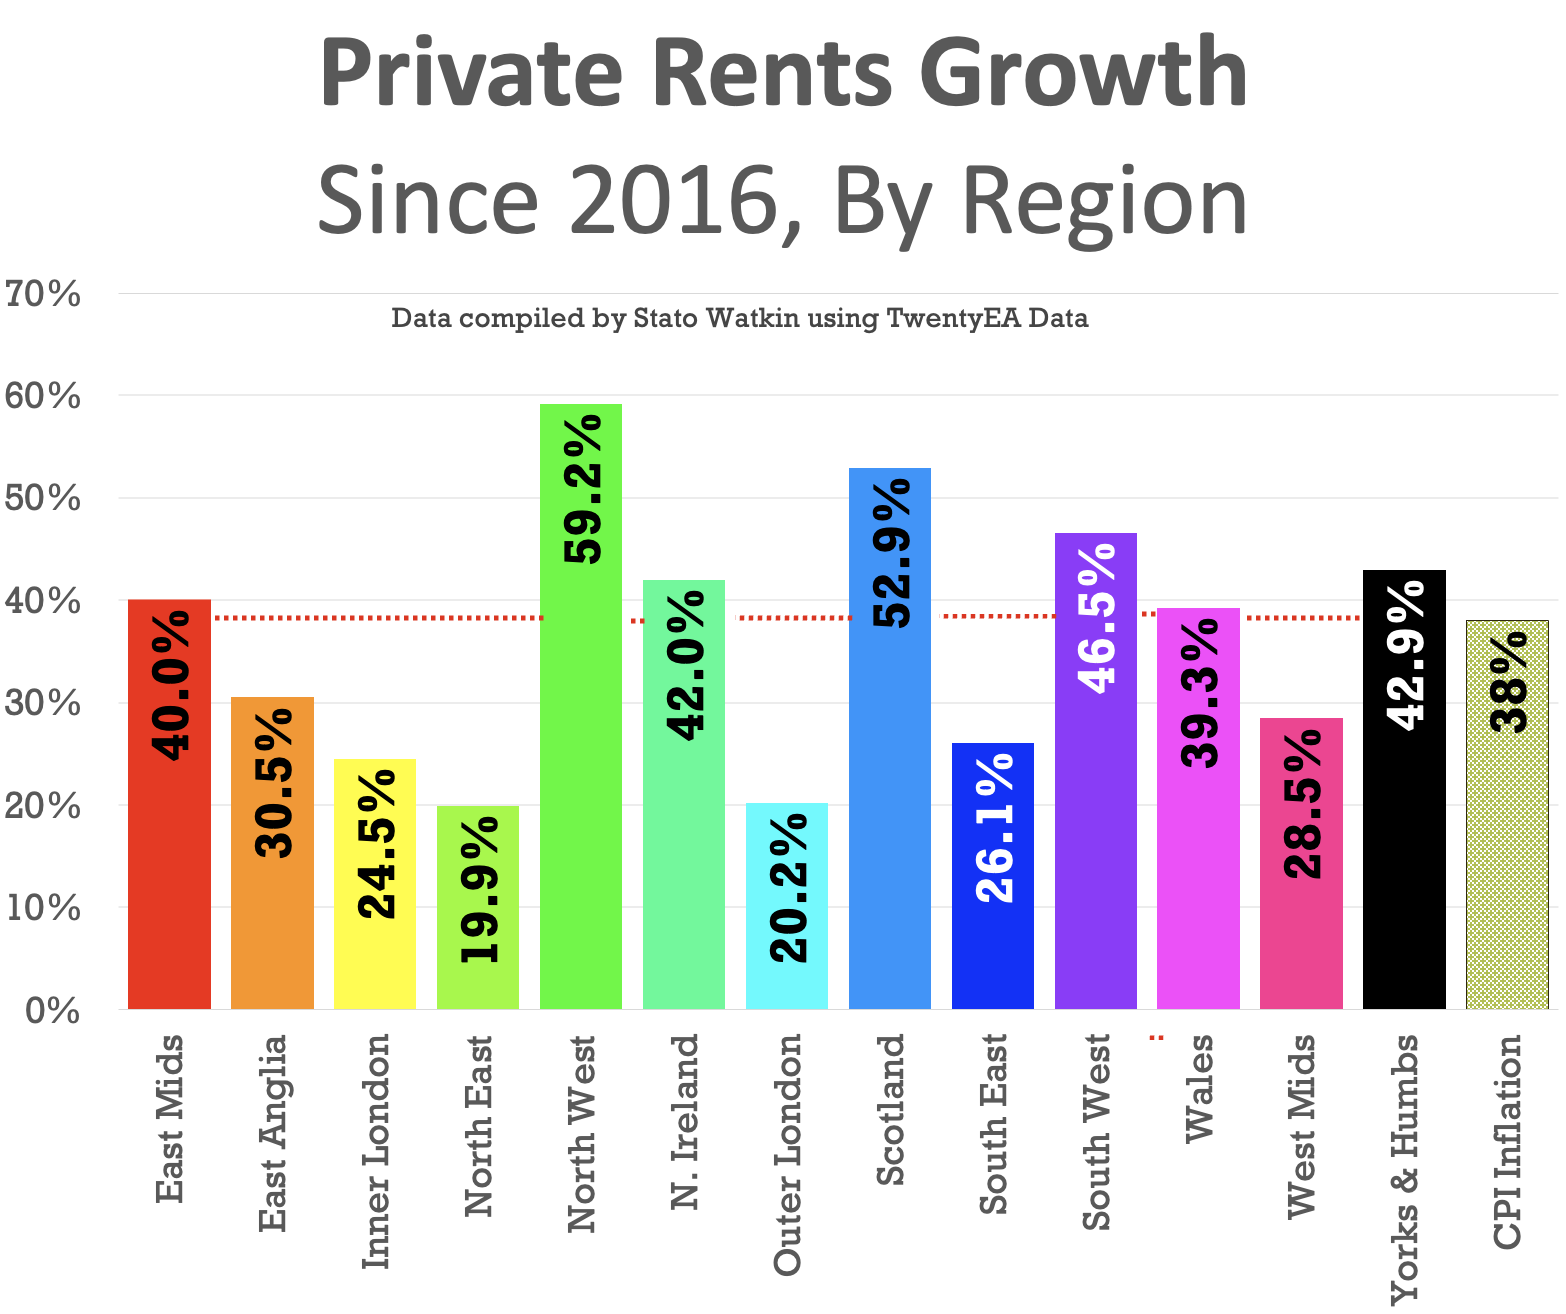
✅ Rental Market (in arrears)
- August 2025 average rent: £1,828 pcm (vs £1,779 pcm in August 2024).
- YTD 2025 average: £1,776 pcm.
✅ Local Focus on the Show:
Bridlington
Daily news email from EYE
Enter your email below to receive the latest news each morning direct to your inbox.


